Publications /
Policy Brief
This policy brief examines what the 2025–2026 period reveals about the future of global energy risk and the energy transition. After the shocks of 2021–2023, 2025 brought broad price easing: oil and coal prices declined as supply growth outpaced demand, and the World Bank projects further declines in the global energy price index in 2026, offering short-term relief for energy-importing economies.
The brief argues, however, that the macroeconomic relevance of energy entering 2026 is no longer defined primarily by commodity price levels, but by the distribution of risks and by the capacity of energy systems—grids, flexibility resources, supply chains, and investment frameworks—to absorb shocks and deliver reliable power. It identifies four structural forces shaping 2026 and beyond: artificial intelligence-related demand growth, grid congestion and resilience constraints, critical mineral concentration, and a capital-rich but execution-constrained investment environment. Taken together, these dynamics suggest that energy risk is increasingly shifting toward infrastructure and supply-chain bottlenecks, with widening asymmetries across regions, particularly for emerging and developing economies.
1- Introduction
The energy system entering 2026 is characterized by a growing gap between easing commodity markets and rising structural pressures across electricity networks, supply chains and investment conditions. Market indicators point to a projected 12% decline in the global energy price index in 2025, followed by an additional decrease of 10% in 2026, reflecting subdued oil consumption growth, expanding supply, increasing U.S. LNG exports, and a plateau in coal demand (World Bank Group, 2025). This relative softening of prices contrasts with the volatility of recent years and provides temporary macroeconomic relief for importing economies. However, it masks deeper vulnerabilities that have become more pronounced as the transition scales.
A key source of fragility lies in the evolving nature of energy security. Traditional concerns tied to oil and gas have widened to include critical minerals, where supply chains remain highly concentrated and increasingly exposed to export controls and geopolitical tensions. These minerals are essential for renewable power technologies, electric mobility, grid equipment, and battery storage, but also for emerging layers of the economy such as artificial intelligence (AI) infrastructure, defense systems, and advanced manufacturing. The high concentration of refining capacity introduces systemic risks that market forces alone are unlikely to resolve (IEA, 2025a).
At the same time, pressures on the energy system are intensifying. Global electricity demand is expected to grow by 3.3% in 2025 and 3.7% in 2026, well above the average of the past decade, driven by electrification, rising cooling needs and the rapid expansion of data centers (IEA, 2025b). Electricity use from data centers alone is estimated at 700 TWh in 2025 (Wood Mackenzie, 2025), indicating a structural increase in demand that many grids are not yet equipped to accommodate. Congestion, delays in connecting new capacity, curtailment of variable renewables, and tight markets for transformers and storage technologies reveal a growing misalignment between deployment ambition and system integration capacity (IEA, 2025a).
These pressures are compounded by more restrictive financial and policy conditions. Higher financing costs, longer equipment lead times, and increased policy and trade uncertainty are reshaping investment decisions across the energy value chain. Firms are emphasizing resilience, operational efficiency and capital discipline, and their investment strategies are increasingly sensitive to regulatory uncertainty and supply-chain risk. As a result, the binding constraints of the transition are shifting from the cost of technologies alone to the cost and feasibility of integrating them into complex, capital-intensive systems.
Taken together, these dynamics define the landscape shaping energy trends in 2025 and the outlook for 2026. Commodity markets may be stabilizing, but system adequacy, supply-chain concentration, and investment conditions are becoming the critical determinants of the trajectory of the global energy transition. This policy brief examines how these forces evolved over 2025 and assesses their implications for 2026.
2- 2025 in Numbers: Prices, Demand, Supply
2.1 Prices: The End of the Crisis, Not of Volatility[1]
Energy prices in 2025 marked a clear departure from the volatility of previous years, with a broad easing across oil and coal markets, contrasting with a pronounced increase in natural gas prices. The result is a landscape in which the aggregate energy price declines, but underlying market dynamics diverge sharply across fuels, reflecting differences in supply conditions, regional demand patterns and geopolitical sensitivities.
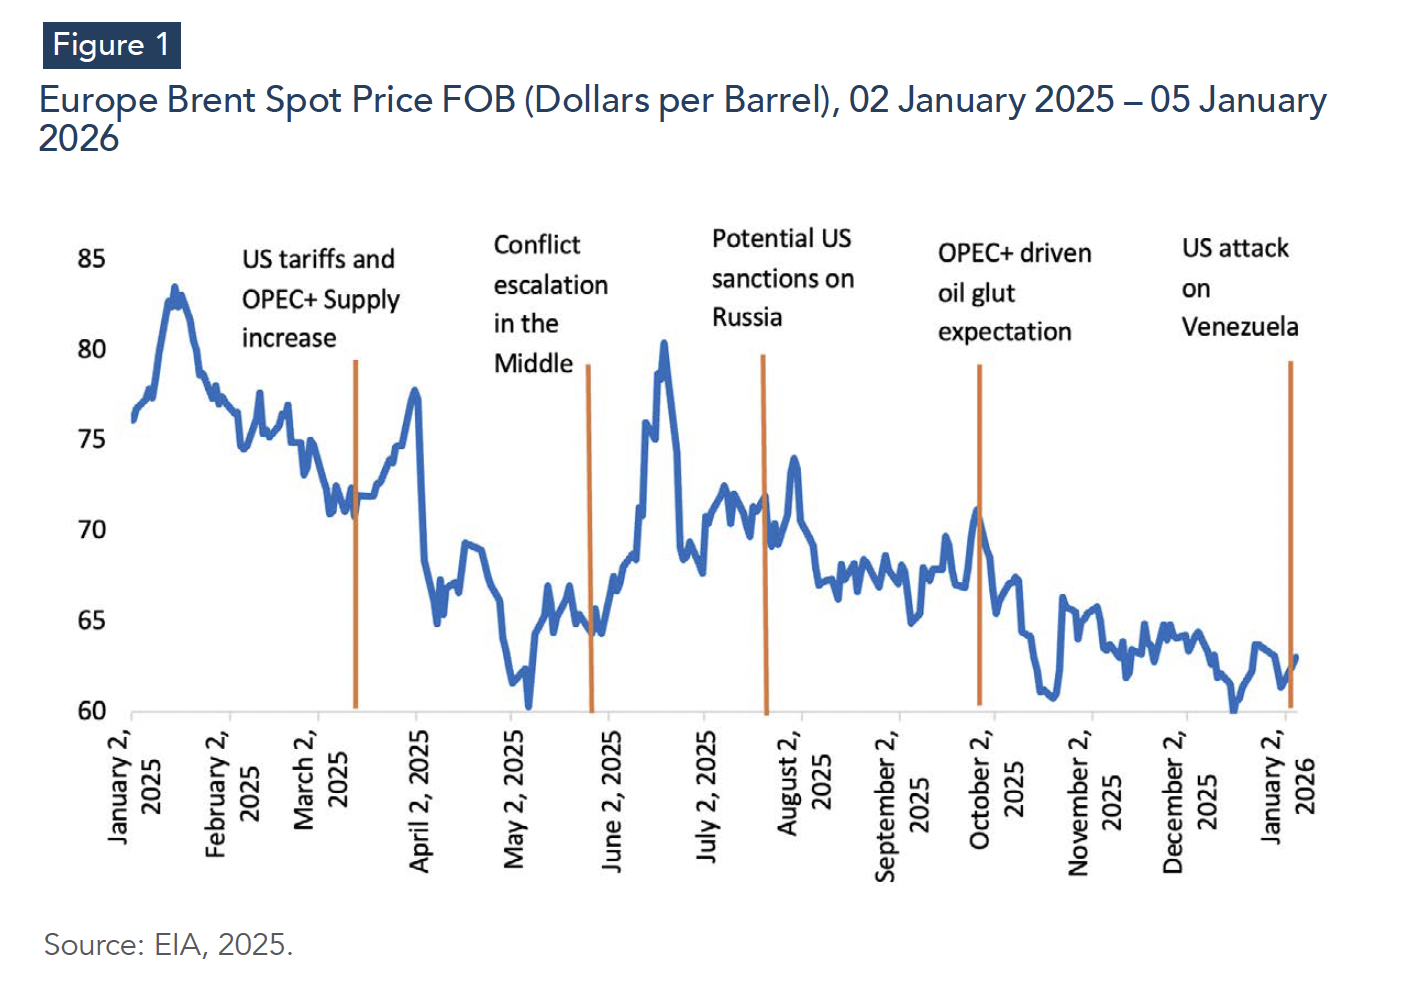
Crude oil prices declined markedly over 2025, reflecting a looser market balance as demand growth moderated and supply continued to rise. Quarterly averages fell from 74.2 U.S. dollars per barrel (USD/bbl) in 2025Q1 to 62.1 USD/bbl in 2025Q4, with only brief mid-year rebounds. Consistent with this trajectory, each quarter of 2025 remained below its 2024 level. On an annual basis, crude prices declined by 14%, from 78.7 USD/bbl in 2024 to 67.4 USD/bbl in 2025, reinforcing the shift from the tight conditions of 2022-2023 toward a surplus-leaning regime. Furthermore, although prices temporarily rebounded at several points during 2025 amid heightened geopolitical tensions, these episodes did not translate into a sustained reversal of the downward trend. Daily data therefore suggest that short-lived risk premia were insufficient to counteract the broader easing in market fundamentals (Figure 1).
Natural gas markets, by contrast, experienced a sharp upward adjustment, most notably in the United States, highlighting widening regional differences in gas pricing. The U.S. benchmark averaged 3.53 USD per million British thermal unit (mmbtu) in 2025, 61% higher than in 2024 (Figure 2), reflecting both a recovery from unusually low 2024 levels and stronger LNG-related demand for U.S. supply. In particular, U.S. prices in 2025Q3 were 44% higher year-on-year (compared to 2024Q3), driven by demand for U.S. LNG shipments to Europe, even as Europe’s natural gas price index moderated from the early-year spike. European benchmark prices increased in annual average terms by 9% (from 10.96 to 11.96 USD/mmbtu), but the 2025 profile was front-loaded, peaking in 2025Q1 before easing through Q2-Q4. Japan was the only major benchmark to decline: the annual LNG average fell by 7% (from 12.84 to 12.00 USD/mmbtu), consistent with softer Asian demand and increased competition from alternative fuels. Taken together, these trends confirm that natural gas was the only energy commodity to record a sustained annual increase in 2025, with price dynamics increasingly shaped by LNG trade flows and regional market conditions rather than a uniform global cycle.
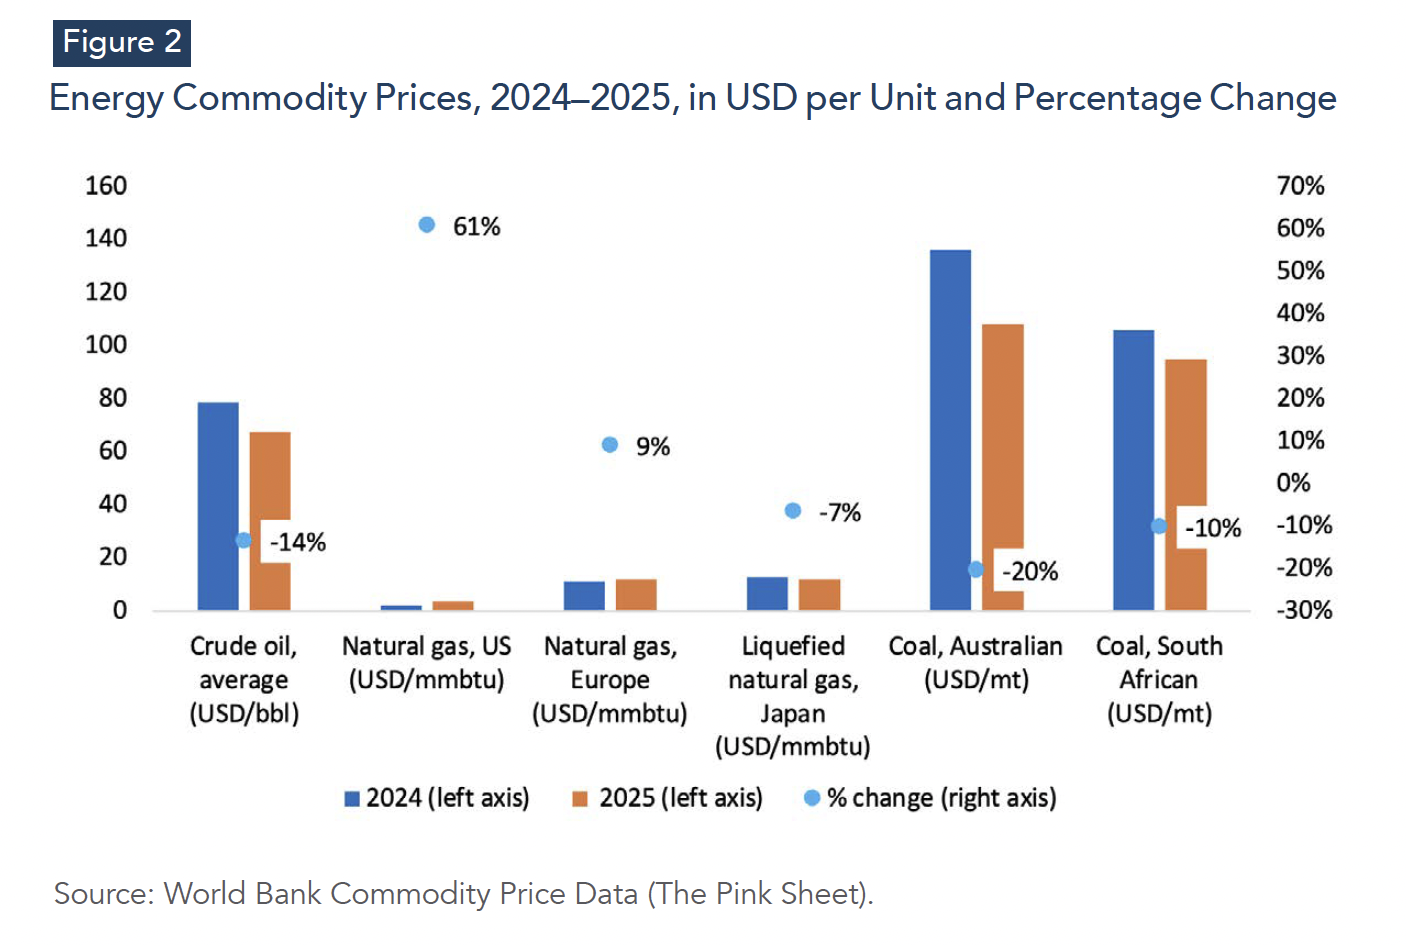
Coal prices continued their multi-year correction across both Australian and South African benchmarks. In annual average terms, Australian coal prices declined from 136.15 USD per metric ton (USD/mt) in 2024 to 108.39 USD/mt in 2025, representing a 20% decline, while South African coal fell from 105.77 USD/mt in 2024 to 94.88 USD/mt in 2025, a 10% decline (Figure 2). The decrease was driven mainly by sharp falls in the first half of 2025, before a temporary rebound in 2025Q3, attributed to strong Asian demand amid heat waves and reduced exports from Australia and Indonesia. Overall, the 2025 correction remains consistent with a market characterized by adequate supply conditions and a gradual weakening of structural coal demand in several regions as renewable penetration rises and fuel-switching options expand.
Overall, the 2025 energy price environment is best characterized by broad price easing combined with pronounced inter-fuel divergence. Oil and coal prices declined steadily as supply growth outpaced demand growth and substitution pressures intensified, while natural gas moved in the opposite direction, most notably in the United Stated, reflecting a rebound from unusually low 2024 levels driven by stronger LNG export demand. For policymakers, this divergence implies a more complex risk landscape: the easing of headline energy prices does not translate into uniform external-balance relief, and fuel-specific dynamics—particularly gas pricing—will remain central to macroeconomic and investment outcomes in 2026.
2.2 Demand: Electricity and Gas Up, Coal Plateauing, Oil Still Growing
Global energy demand in 2025 follows a differentiated trajectory across fuels, with electricity and natural gas consumption continuing to expand, coal demand showing early signs of plateauing, and oil demand maintaining a moderate growth.
Global oil demand continues to expand in 2025, but the pace of growth remains a point of divergence across leading institutions, reflecting both uncertainty over the strength of global activity and structural shifts in consumption patterns. The International Energy Agency (IEA) projects that world oil demand will rise by 830 thousand barrels per day (kb/d) in 2025, supported by an improving macroeconomic and trade outlook but constrained by weaker momentum in advanced economies and the gradual dampening effects of electrification in key markets (IEA, 2025c). OPEC’s assessment is more optimistic, projecting demand growth of 1.3 million barrels per day (mb/d), about 1.3% year-on-year growth, which would bring total world oil demand to 105.1 mb/d in 2025, up from 103.8 mb/d in 2024 (OPEC, 2025). While the magnitude differs, both projections point to a year of moderate demand growth, consistent with a market where consumption rises but does not materially tighten balances.
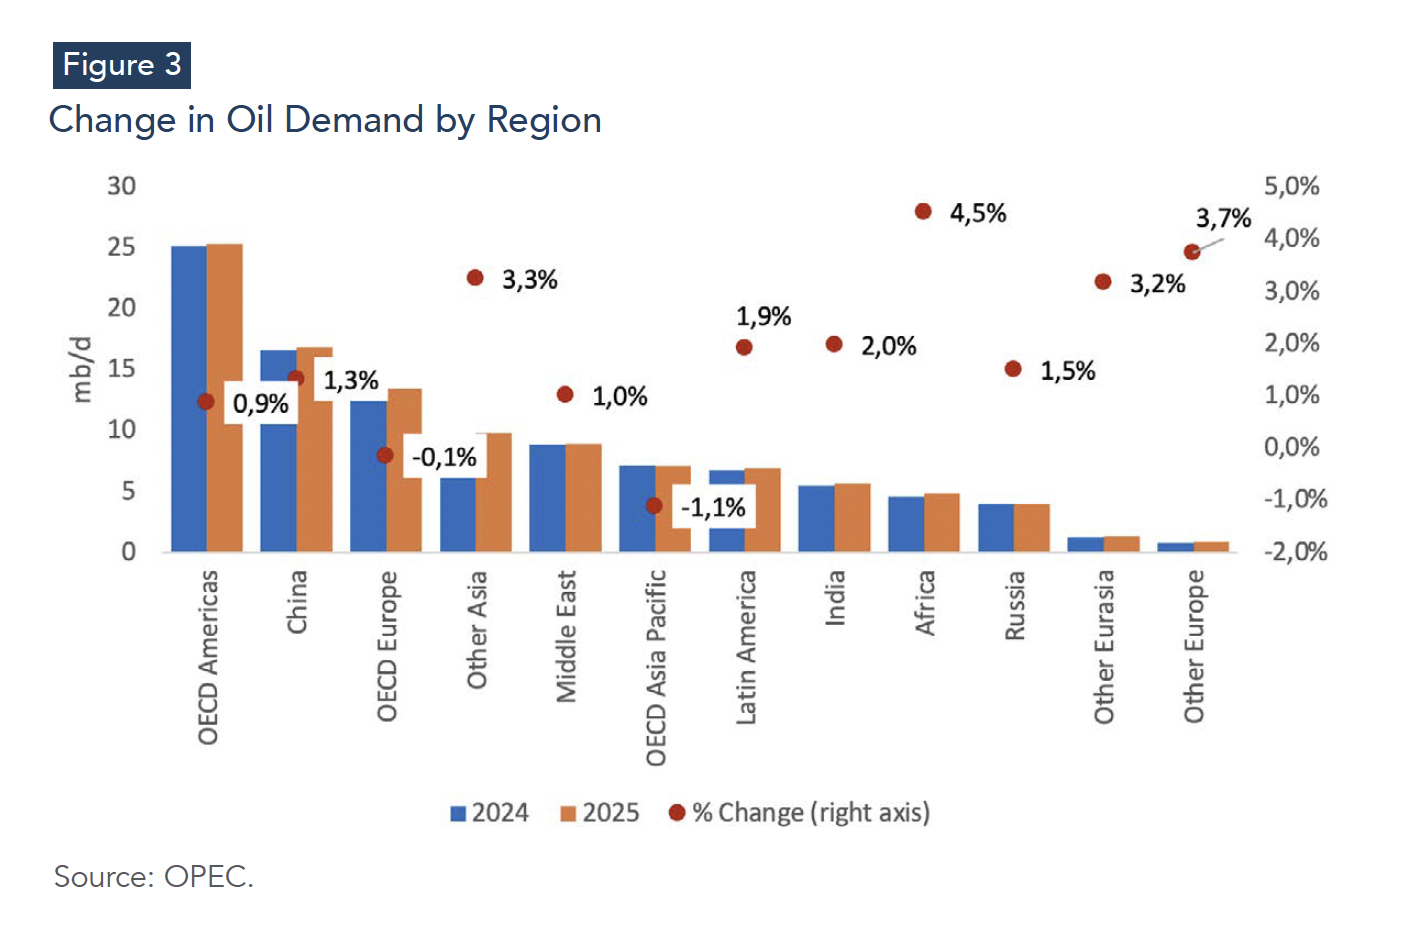
Beyond aggregate growth, demand gains are concentrated in non-OECD economies, while OECD consumption is broadly stable (Figure 3). OPEC’s regional breakdown shows modest growth in OECD Americas (+0.9%), offset by slight declines in OECD Europe (-0.1%) and OECD Asia Pacific (-1.1%), confirming the stagnation of demand in mature markets (OPEC, 2025). In contrast, non-OECD regions account for the bulk of the incremental demand. China remains a major contributor, though its demand growth is increasingly constrained by the rapid uptake of electric and hybrid vehicles, while India continues to expand steadily (+2.0%) alongside strong gains in Other Asia (+3.3%), the Middle East (+1.0%), and Latin America (+1.9%). Demand growth in Africa reaches 4.5%, making it one of the fastest-expanding regions, though from a low base (World Bank, 2025; OPEC, 2025). Therefore, 2025 is a year in which oil demand grows, but at a pace too moderate to absorb supply expansion, contributing to a looser market balance and reinforcing downward price dynamics (World Bank Group, 2025).
Natural gas demand displays sharper regional divergence in 2025, with weather and power-sector balancing needs dominating short-term consumption patterns. In the first half of 2025, demand rose in Europe and North America, driven by colder-than-normal temperatures in North America and a weather-related decline in renewable electricity output in Europe, both of which lifted gas-fired power generation. By contrast, demand in Asia Pacific, particularly China and India, fell during the first half of 2025 as industrial and refining consumption weakened and renewable output strengthened, consistent with the decline in China’s LNG imports over eleven consecutive months through September 2025 (World Bank Group, 2025). Despite these divergences, the World Bank projects that global gas consumption will rise in 2025 to about 4,270 billion cubic meters (bcm), an increase of around 1.4%. In the World Bank regional breakdown, net demand growth in 2025 (+57 bcm) is led by Europe (+16 bcm) and North America (+13 bcm), indicating that the market remained driven by short-term weather variability, regional fuel-switching dynamics, and LNG market conditions rather than uniform structural demand growth (Figure 4).
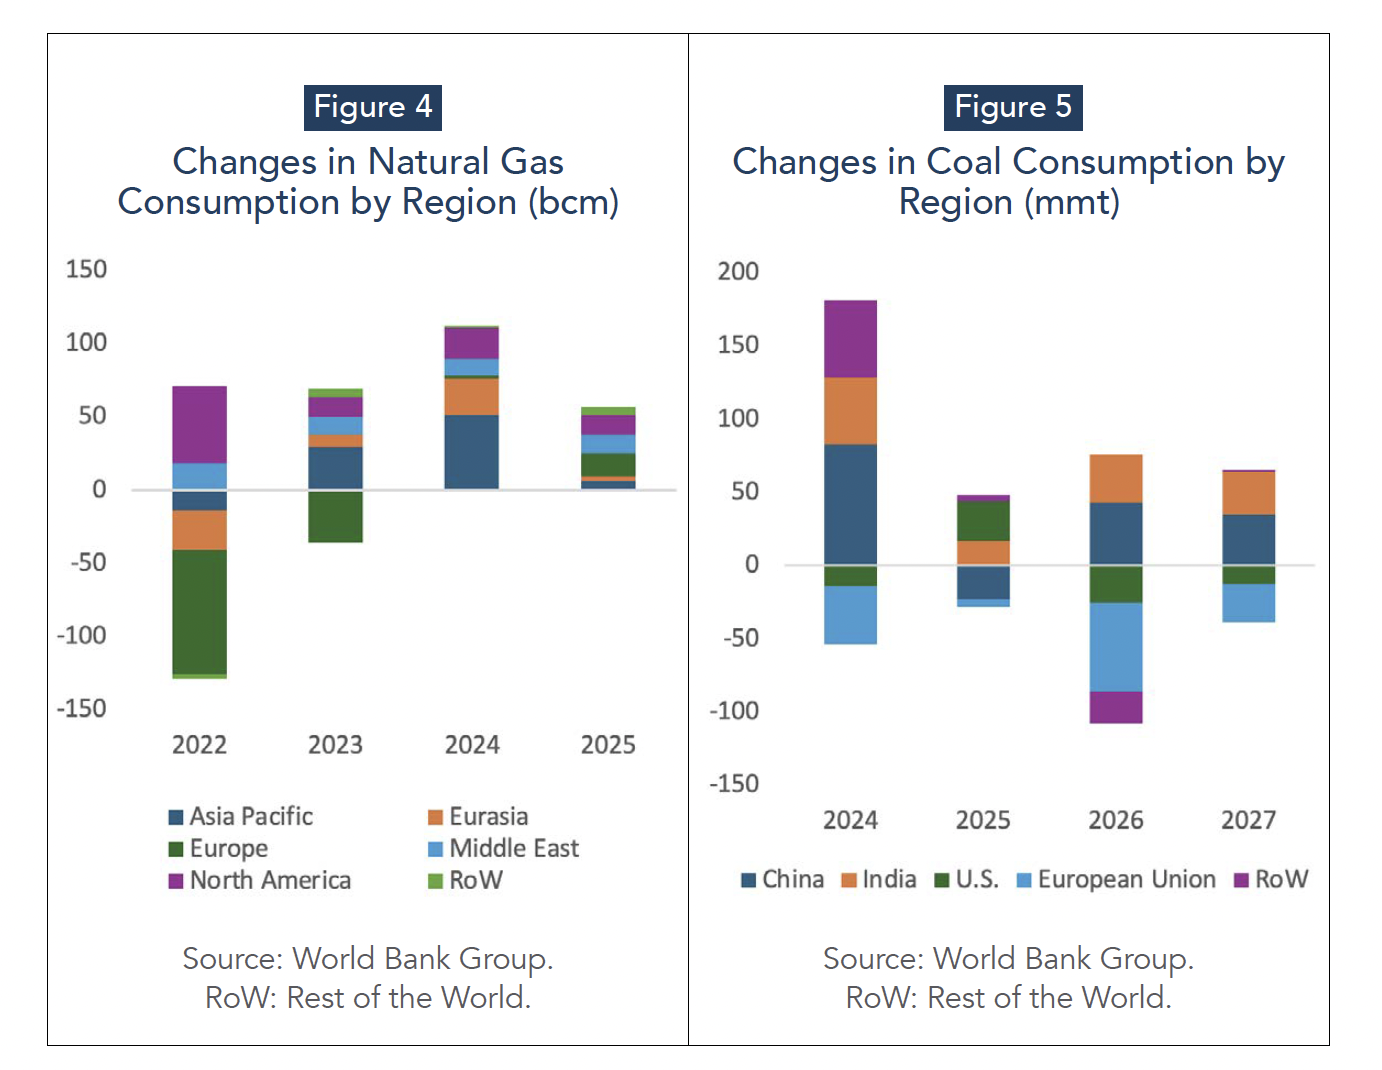
Coal demand appears to be flattening, as global consumption declined by around 1% year-on-year in the first half of 2025 (World Bank Group, 2025). This aggregate figure masks pronounced regional divergence, largely driven by differences in power demand and renewable generation (Figure 5). In China and India, coal-fired generation fell as electricity demand growth moderated and renewable output increased. In the United States, coal consumption rose in response to elevated power demand and higher natural gas prices. The result is a coal market increasingly shaped by short-run substitution and renewable variability, producing a more muted and uneven demand trajectory than in previous years.
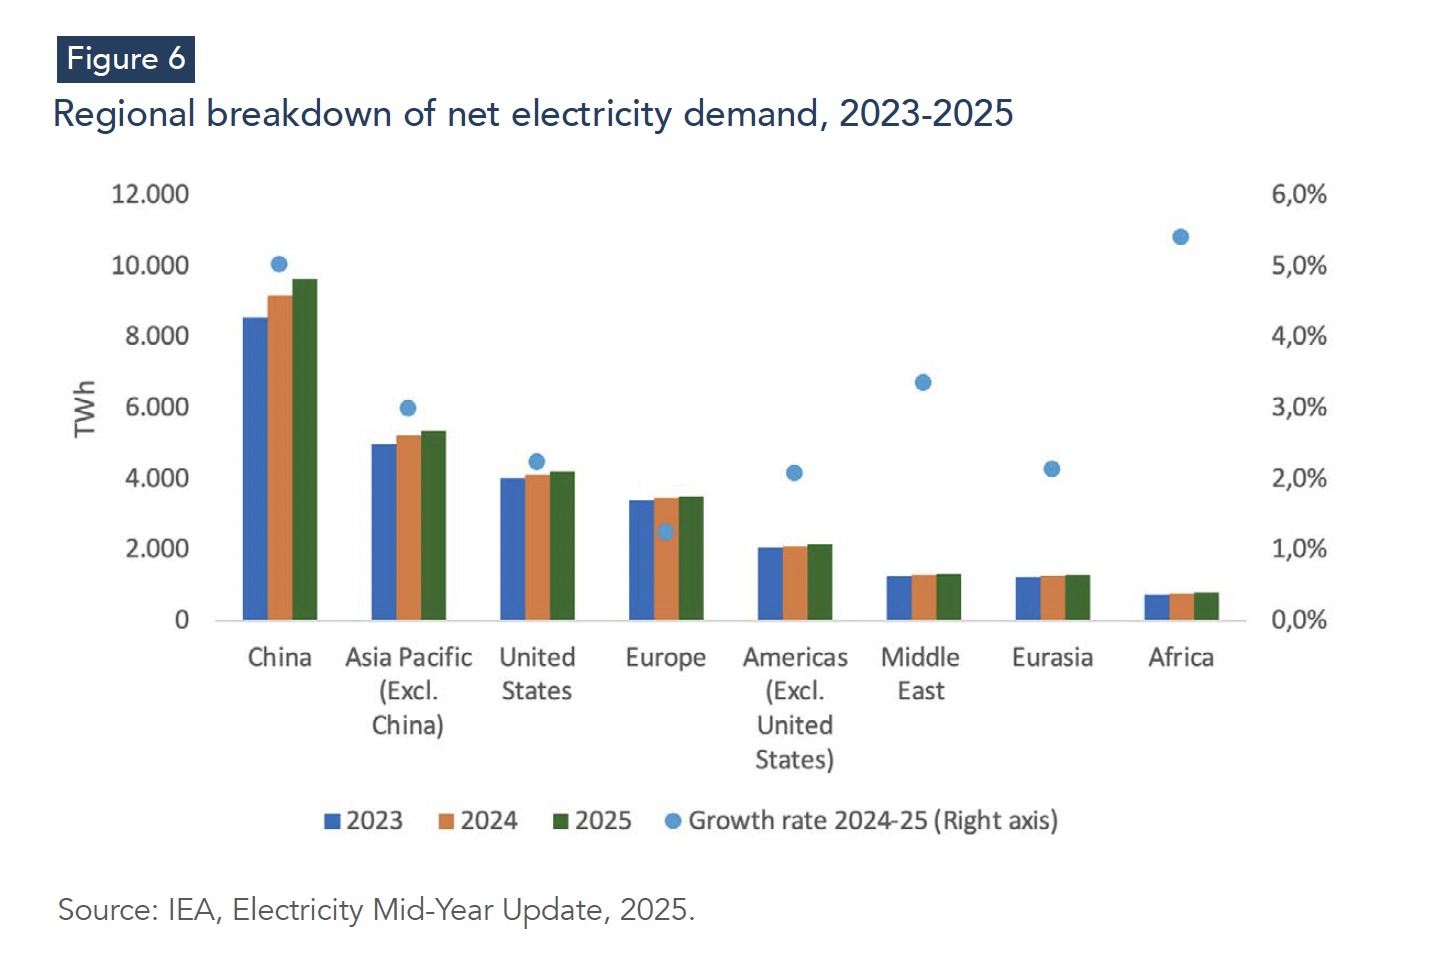
Electricity remains the most dynamic component of global energy demand. Global electricity consumption is projected to increase by 3.3% in 2025, down from the 4.4% surge in 2024, but still well above the 2015-2023 average of 2.6% (IEA, 2025b). Growth continues to be supported by structural drivers, including rising cooling needs, expanding appliance ownership, ongoing electrification, and the rapid expansion of data centers and AI-related computing loads. China contributes nearly half of global electricity demand growth, with consumption rising by 5% in 2025 after a 7% increase in 2024. India’s electricity demand is projected to grow by 4% in 2025, supported by rising temperatures and continued electrification. In advanced economies, growth remains positive but more moderate: U.S. demand is expected to rise by 2.3%, supported by data centers and new industrial loads, while electricity consumption in Europe grows by 1.1% (Figure 6) (IEA, 2025b).
Taken together, the 2025 demand landscape shows a global energy system in which aggregate consumption continues to rise, but the sources and intensity of that growth differ sharply across fuels and regions.
2.3 Supply and Capacity: Renewables Dominate Additions, Fossils Dominate the Base
Energy supply conditions in 2025 remained broadly supportive of lower prices, not because demand collapsed, but because supply growth continued to outpace consumption growth in key fuels, particularly oil.
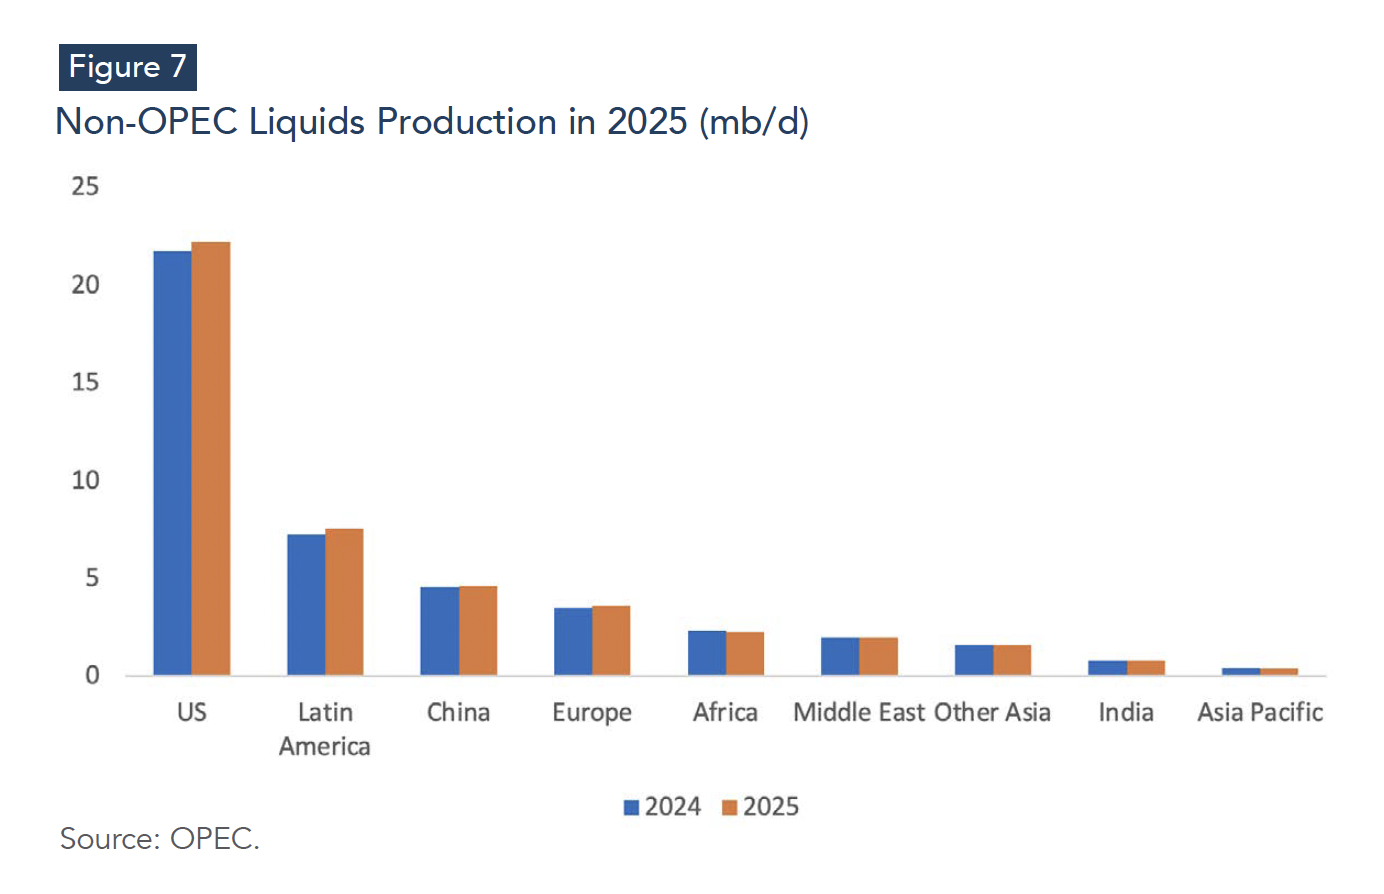
In liquid fuel markets (crude, condensate, natural gas liquids, and other liquids), incremental supply growth in 2025 was driven primarily by producers outside OPEC+. Non-OPEC+ liquids supply is projected to rise from 53.20 mb/d in 2024 to 54.15 mb/d in 2025, an annual increase of 0.96 mb/d, or roughly 2% (OPEC, 2025). This growth is concentrated in the Americas (+0.58 mb/d), led by the United States (+0.46 mb/d), while non-OECD supply growth remains more moderate (+0.33 mb/d), driven largely by Latin America (+0.31 mb/d) (Figure 7) (OPEC, 2025). At the same time, the World Bank highlights that oil markets were moving into surplus conditions in 2025, with supply increasingly exceeding demand as output expanded and demand growth remained moderate, reinforcing downward pressure on prices (World Bank Group, 2025).
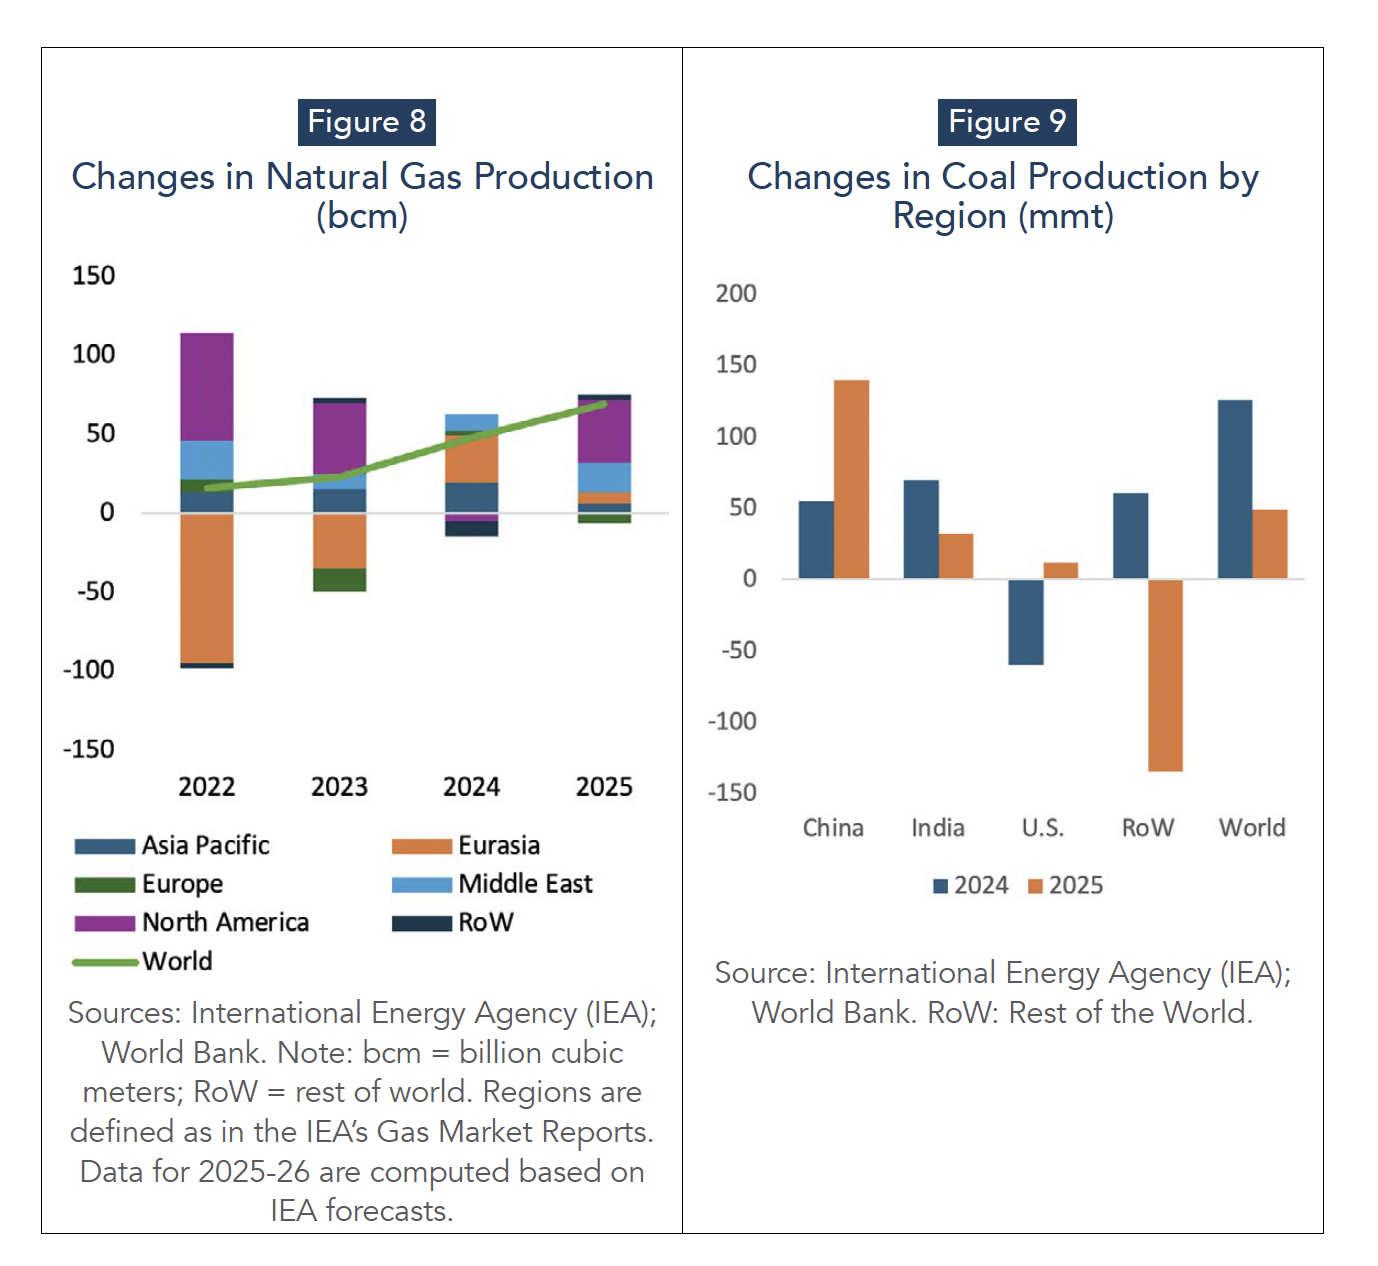
Natural gas supply expanded moderately in 2025, but growth remained highly concentrated geographically, sustaining regional tightness rather than producing a uniform easing. Global production is expected to rise by 1.7% in 2025 to about 4,250 bcm, with the bulk of net additions coming from North America (+40 bcm), while Europe records a contraction (−6 bcm) and other regions contribute more modest gains (Figure 8) (World Bank Group, 2025). The World Bank highlights that U.S. output rose by 2.4% year on year in the first half of 2025 following the early-year price rebound, and that U.S. LNG exports were redirected toward Europe, which received 57% of U.S. LNG shipments in the first seven months of 2025 amid low European storage levels ahead of the 2025–26 heating season (World Bank Group, 2025). At the same time, Russian production declined by 3.2% year on year in the first half of 2025 as exports to Europe continued to weaken. Overall, the supply picture in 2025 is one of expanding global volumes but persistent regional sensitivity, reflecting the concentration of marginal supply growth in North America.
Coal supply dynamics in 2025 suggest that the market adjustment is driven less by demand collapse than by highly uneven regional supply changes. Global coal production is projected to increase by 49 Mt, but this net gain is concentrated in a few producers (Figure 9): China alone contributes +140 Mt, while India adds +32 Mt and the United States +12 Mt. These increases are more than offset elsewhere by a sharp contraction in the rest of the world (−135 Mt), consistent with supply constraints and disruptions affecting key exporters and reduced output in sanctioned producers (World Bank Group, 2025). The result is that global coal supply remains broadly expansionary despite flattening demand, reinforcing downward pressure on international prices and increasing risks for higher-cost exporters. Meanwhile, coal use in power generation continues to diverge by region, declining in China and India with stronger renewable output, but rising in the United States and parts of Europe amid higher gas prices and weaker renewable generation (World Bank Group, 2025).
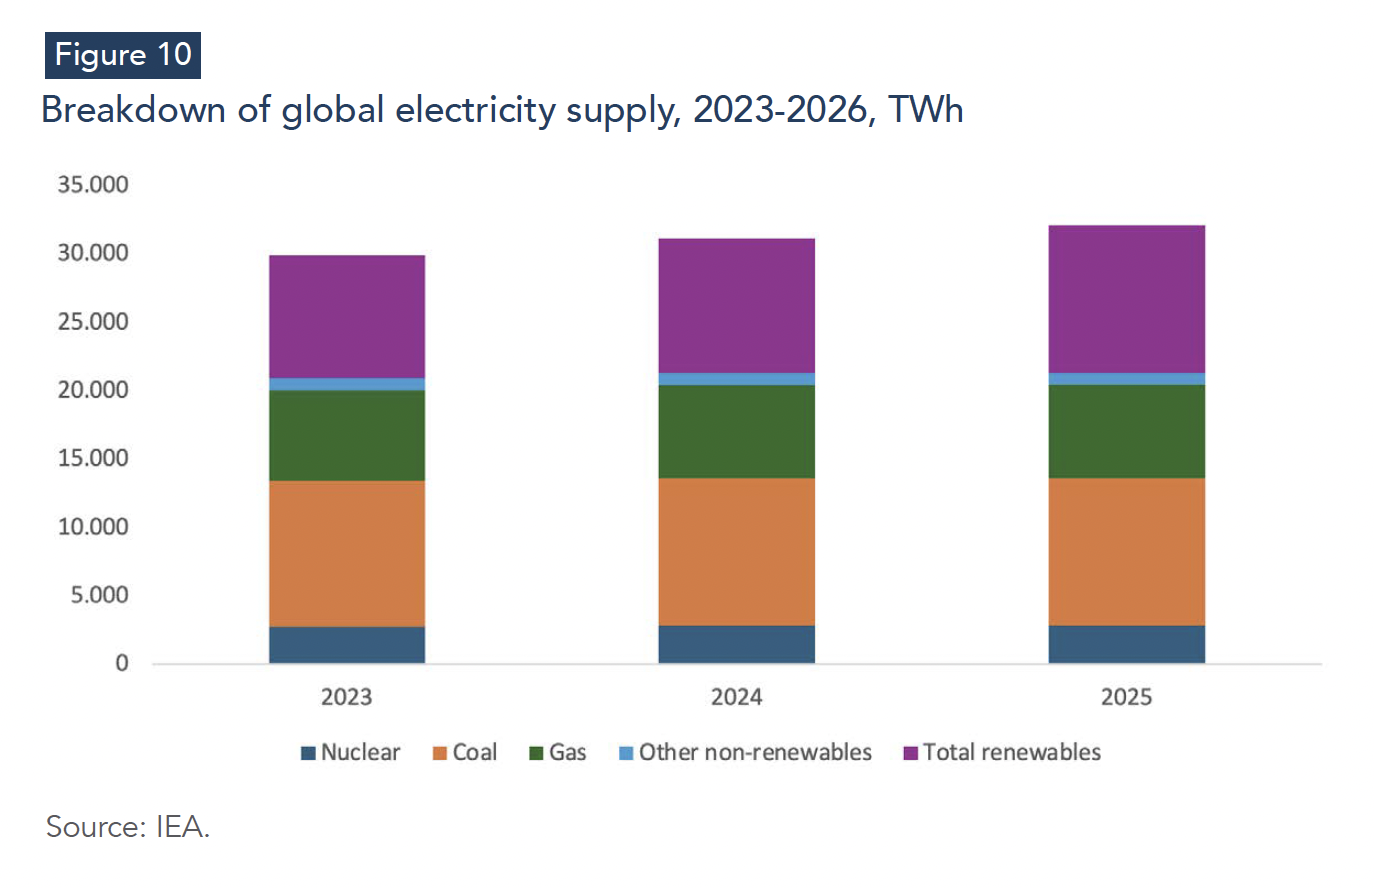
The power sector illustrates the transition’s dual speed: renewables are expanding rapidly, yet fossil generation is retreating only slowly. Global renewable electricity output is projected to rise from 9,871 TWh in 2024 to 10,805 TWh in 2025 (+9.5% year-on-year), while coal-fired generation edges down only marginally from 10,790 to 10,721 TWh (−0.6%). Gas-fired generation continues to increase modestly, from 6,783 to 6,869 TWh (+1.3%), reflecting its continued role as a dispatchable supply when weather and renewable variability require balancing. Nuclear output also rises to a new high in 2025, supported by reactor restarts and new capacity coming online. The net effect is clear: low-emissions sources account for most incremental generation, but the slow decline of coal and the continued reliance on gas underscore that grid integration, storage deployment, and operational flexibility remain the binding constraints on faster fossil displacement (IEA, 2025b).
Overall, the 2025 supply and capacity landscape confirms a transition that is accelerating in technology deployment but remains constrained by system integration. Renewables are shaping the marginal growth profile, yet fossil fuels continue to anchor power system adequacy, while oil supply expansion—driven largely by non-OPEC+ liquids—maintains downward pressure on crude market fundamentals.
3- Structural Drivers for 2026 and Beyond: AI, Grids, Minerals, and Capital
In 2026, the energy transition enters a more mature but more constrained phase than in the early 2020s. Successive shocks—the pandemic, geopolitical disruptions, and the return of trade tensions—have added persistent uncertainty to macroeconomic conditions and global supply chains. While major economies have so far avoided outright recession (IMF, 2025), the adjustment has been uneven and has coincided with rising stress on energy systems, tighter security concerns, and greater policy fragmentation. The result is a transition environment increasingly defined by hard trade-offs around system integration, execution speed, capital allocation, and geopolitical exposure, rather than by the availability of clean technologies alone (Deloitte, 2025; S&P Global, 2025a).
Four forces are particularly central for 2026 and beyond: the rise of AI as a new load driver, the growing importance of grid adequacy and resilience, the concentration of critical mineral supply chains, and an investment landscape that remains capital-rich but execution-constrained.
3.1 AI and Data Centers: A New Structural Demand Driver
AI is translating into measurable electricity demand growth through data centers, with load profiles and system implications that differ from earlier waves of digitalization. The novelty is not that data centers exist, but that AI-driven infrastructure is now being deployed at a scale and pace that transforms data-center electricity demand from a secondary load into a material contributor to incremental electricity demand growth, particularly in advanced economies and China. This trend has direct implications for power-system planning, investment signals and the short-term trajectory of power-sector emissions (IEA, 2025b; Deloitte, 2025).
The acceleration is visible in recent demand dynamics. The IEA estimates that global data-center electricity consumption grew at around 3% annually during 2005–2015, then accelerated to around 10% annually during 2015–2024, reflecting the expansion of cloud services and, increasingly, AI-related workloads (IEA, 2025d). In 2024, data centers consumed roughly 415 TWh globally (about 1.5% of global electricity demand), with the United States alone accounting for around 180 TWh, nearly 45% of the global total (IEA, 2025d). Looking forward, projections vary across sources, partly due to uncertainty over utilization rates, definitional differences, and the treatment of on-site generation. Yet even conservative scenarios imply a sharp step-up from the 2024 baseline, consistent with the ongoing wave of new capacity announcements and hyperscaler investment plans (Wood Mackenzie, 2025; Gartner, 2025).
This expansion of electricity demand is underpinned by a rapid acceleration in capital expenditure. Investment in data centers by companies like Meta, Amazon, Alphabet and Microsoft is expected to reach USD 320 billion in 2025, up from USD 230 billion in 2024, largely driven by AI-related data infrastructure and computing capacity (IEA, 2025b).
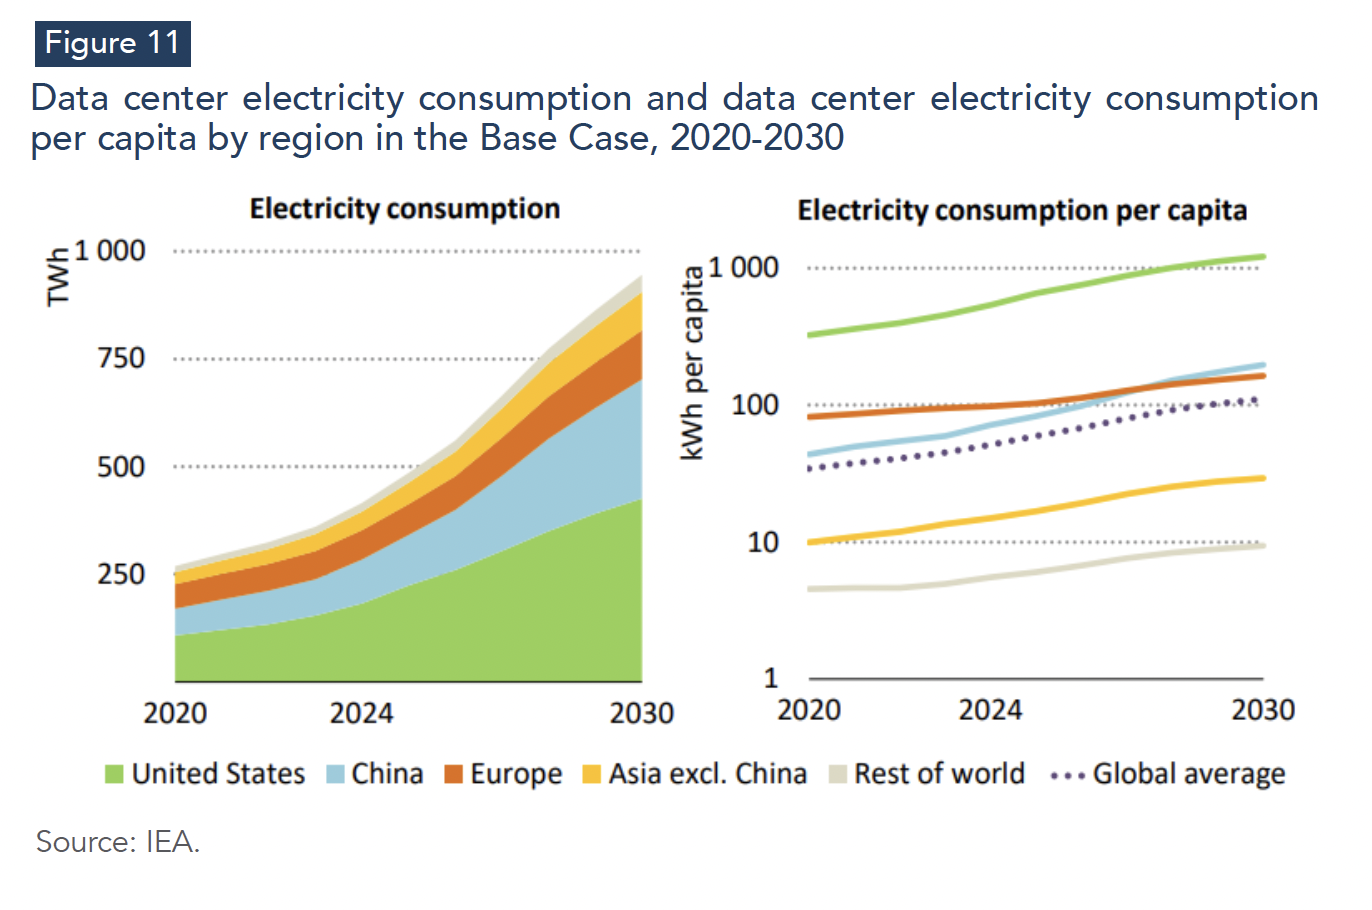
The macroeconomic relevance of this demand does not stem from its global share alone, which remains modest in aggregate terms.[2] Rather, it stems from how this demand behaves. First, it is persistent and asset-anchored: once facilities are built, electricity consumption is structurally embedded over multi-year horizons through long-lived assets such as computing hardware, cooling systems, and grid interconnections. Second, data centers are high-load users with limited short-term flexibility. Demand reductions generally require operational adjustments such as deferred workloads, geographic shifting, or curtailment, and AI training and inference workloads can be particularly demanding in their load profiles (IEA, 2025d). Third, growth is geographically concentrated, with more than 85% of new data-center capacity additions over the next ten years expected in the United States, China, and the European Union, amplifying local planning constraints. New facilities tend to cluster around existing hubs, increasing the marginal burden on already constrained regional grids and interconnection queues (IEA, 2025a; IEA, 2025d; Berahab, 2025).
The energy sources supplying this new load are central to its short-term emissions and cost impact. The sources of electricity supplying this new load are critical for near-term emissions and system costs. Most data centers still draw primarily from the local grid mix, meaning that in the short run they amplify the prevailing generation structure of each system. The IEA estimates that, globally, the physical electricity consumed by data centers is supplied by a mix dominated by coal (around 30%), followed by renewables (27%), natural gas (26%) and nuclear (15%), with coal’s contribution notably higher in China (IEA, 2025c). These shares reflect the physical supply mix (grid electricity adjusted for local fuel mix, plus on-site generation), not the contractual mix implied by clean certificates or power purchase agreements. This distinction matters because procurement strategies do not necessarily translate into immediate system-level decarbonization. Where renewable expansion, storage, and grid connections lag behind load growth, rapid data-center deployment is more likely to be met by existing dispatchable capacity in the short run, raising fossil utilization, emissions intensity and system costs (IEA, 2025d; Wood Mackenzie, 2025).
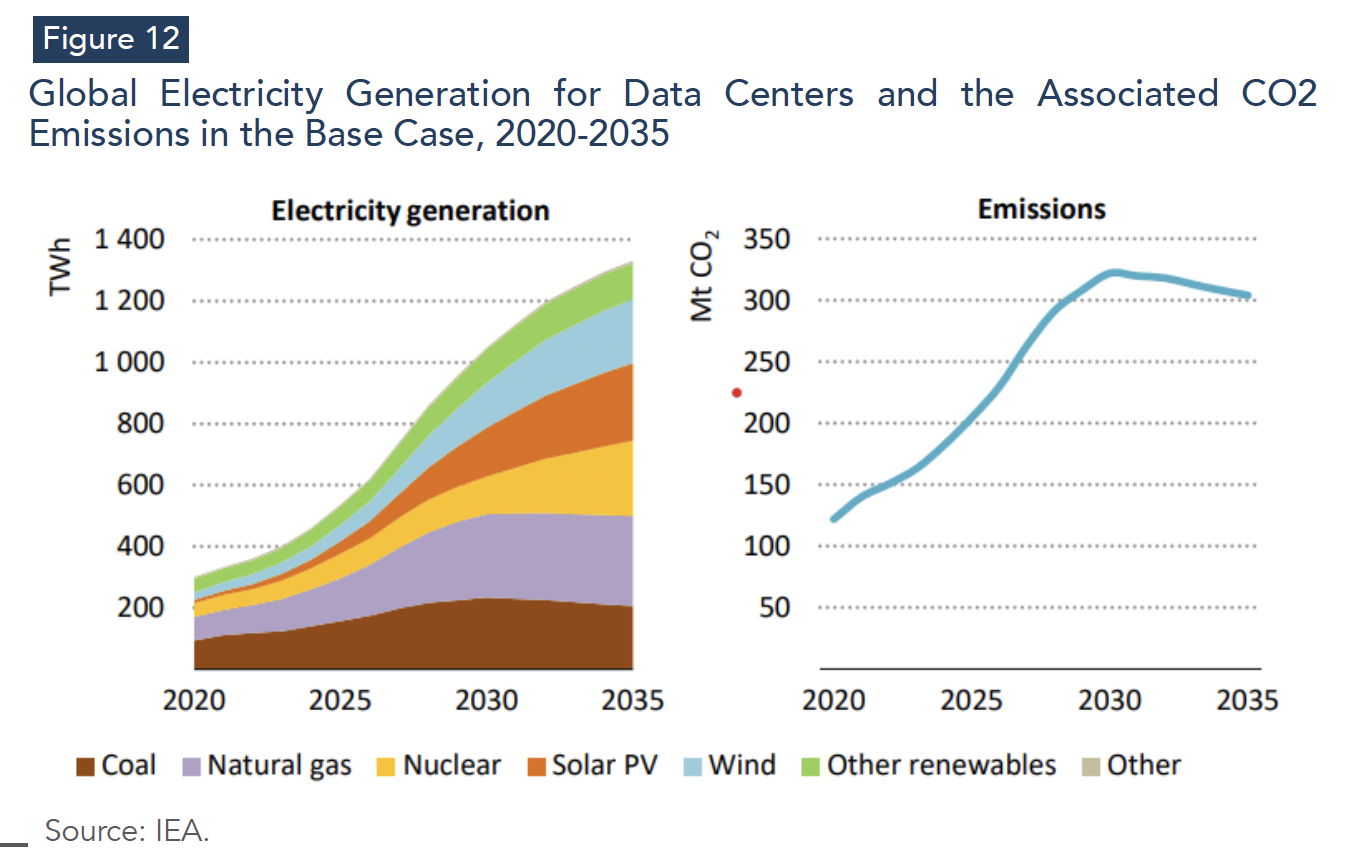
Looking ahead, the supply mix serving data centers is expected to decarbonize, but not fast enough to eliminate near-term trade-offs. Renewables are projected to remain the fastest-growing source of electricity for data centers, with generation projected to grow at an average annual rate of around 22% between 2024 and 2030 in the IEA’s central scenario. Even so, natural gas and coal are still expected to supply more than 40% of additional demand through 2030, through higher utilization of existing assets and new capacity additions in some regions (IEA, 2025c). The implication for 2026 is clear: AI-driven load is expanding faster than the build-out of low-carbon supply and grid integration in many systems, keeping fossil generation as the marginal source of supply in the short run despite rapid renewable growth.
For developing economies, the impacts are asymmetric. Only a limited set is likely to attract large-scale data-center investment in the near term, typically where electricity reliability, grid capacity, and financing conditions are already strong. For most, the effects are indirect, operating through tighter global markets for grid equipment, cooling systems, semiconductors, and refined materials, as well as through increasing competition for capital and clean power supply (IEA, 2025a; Deloitte, 2025). In this sense, AI acts as an amplifier of global infrastructure pressure: it raises the opportunity cost of delayed grid investment and increases the premium on reliable power systems in industrial competition.
3.2 Grid and System Adequacy: Energy Is Cheaper, the System Is Not
The easing of energy commodity prices in 2025 does not translate into a proportional easing of electricity-system costs. Entering 2026, system stress is increasingly shaped by the physical and institutional ability to deliver reliable electricity through grids, flexibility resources, and resilience mechanisms, rather than by the marginal cost of fuels alone. This shift matters because electricity demand growth remains strong, load profiles are becoming more variable and geographically concentrated, and variable renewables are expanding faster than the infrastructure and governance needed to integrate them (IEA, 2025a).
Recent incidents illustrate how quickly failures in networks and system operation can generate economy-wide costs. A transmission-system failure in Chile on 25 February 2025 led to a nationwide outage affecting almost the entire population for 17 hours. On 28 April 2025, Spain and Portugal experienced a major blackout affecting tens of millions of people, with restoration taking more than ten hours (IEA, 2025b; Entsoe, 2025). Regardless of their specific technical causes, these events highlight the rising economic cost of outages in increasingly electrified economies and the growing value of system resilience.
The broader exposure is also rising. The IEA reports that recent annual operational disruptions to critical energy infrastructure have affected energy supplies to more than 200 million households worldwide (IEA, 2025a). Weather-related risks are the principal driver: droughts constrain output from hydropower and some thermal generators, while storms, floods and wildfires force shutdowns and damage assets across multiple generation and network technologies. Power lines are particularly vulnerable, with transmission and distribution grids affected in about 85% of incidents (IEA, 2025a). At the same time, cyberattacks and other malicious risks are becoming increasingly salient as power systems grow more digital and interconnected.
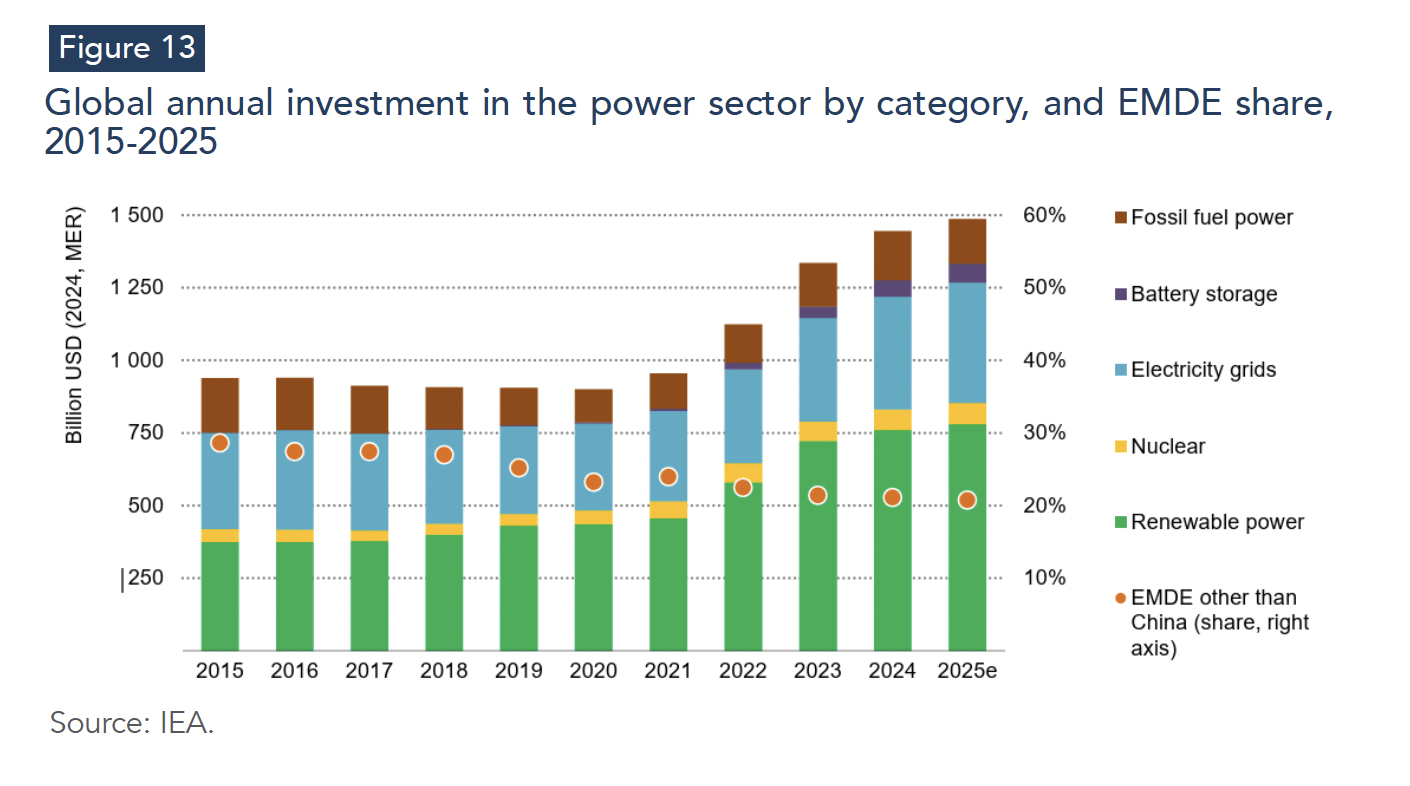
At the core of the emerging constraint is a widening investment and implementation gap. Global annual investment in the power sector reached around USD 1.5 trillion in 2024, driven largely by renewable generation. Yet the expansion of electricity grids is not keeping pace with the scale of generation additions and electrification needs. The IEA estimates that around USD 400 billion per year is invested in grids worldwide, compared with around USD 1 trillion in generation assets—a divergence increasingly reflected in system outcomes (IEA, 2025a; IEA, 2025e). The symptoms are already visible: rising congestion, delays in connecting new generation and demand, higher curtailment of wind and solar output, and more frequent negative pricing episodes in wholesale markets.[3] Tight supply conditions for transformers and other grid components, combined with slow permitting processes, reinforce these bottlenecks. In this context, electricity becomes structurally more expensive in its delivered form, even if primary energy prices fall, because the costs of adequacy, balancing and network reinforcement rise.
Flexibility therefore becomes a binding constraint. As the share of variable renewables increases, reliability depends not only on energy volumes but on the capacity to respond to hourly and seasonal mismatches between supply and demand. Battery storage additions exceeded roughly 75 GW in 2024, strengthening short-term balancing capability, but storage alone cannot substitute for all flexibility needs—especially where seasonal balancing and firm capacity remain critical (IEA, 2025a). Dispatchable resources¾such as gas, hydropower, and nuclear¾therefore remain structurally relevant, increasingly serving adequacy and balancing needs rather than bulk generation. The policy agenda for 2026 shifts accordingly toward accelerating grid build-out (permitting, procurement, and investment for transmission and distributions infrastructure), strengthening market design and remuneration of flexibility, and embedding climate resilience and cybersecurity requirements into system planning and operational standards (IEA, 2025a; IEA, 2025b).
3.3 Critical Minerals: Constraint on the Pace, Not the Direction
The transition towards electrification and renewables is increasingly shaped by material inputs whose supply chains remain structurally concentrated. Across key energy-related minerals, the IEA reports that the three largest refining countries accounted for an average of about 86% of refined output in 2024, up from 82% in 2020 (IEA, 2025a). Unlike oil and gas, where security risks stem from the physical availability of fuels, critical minerals generate vulnerability through bottlenecks in mining, refining and processing capacity, segments characterized by long lead times, high capital intensity and limited short-run elasticity. These inputs are central to batteries, grids and electric vehicles, and increasingly to AI hardware and advanced manufacturing, broadening the scope of energy security to include industrial resilience and strategic autonomy (IEA, 2025a).
Refining remains the most concentrated segment and the clearest source of systemic exposure. Concentration has increased particularly for nickel and cobalt, where recent growth in refining capacity has been disproportionately captured by leading suppliers (IEA, 2025a; Wood Mackenzie, 2025). Despite policy initiatives and a growing pipeline of announced projects, the IEA projects that diversification will proceed only gradually: by 2035, the average share of the top three refined material suppliers is expected to decline only marginally, to around 82%, effectively returning to 2020 concentration levels rather than representing a decisive reduction in dependence (IEA, 2025a). This implies that near-term policy efforts are slowing the rise in concentration rather than reversing it.
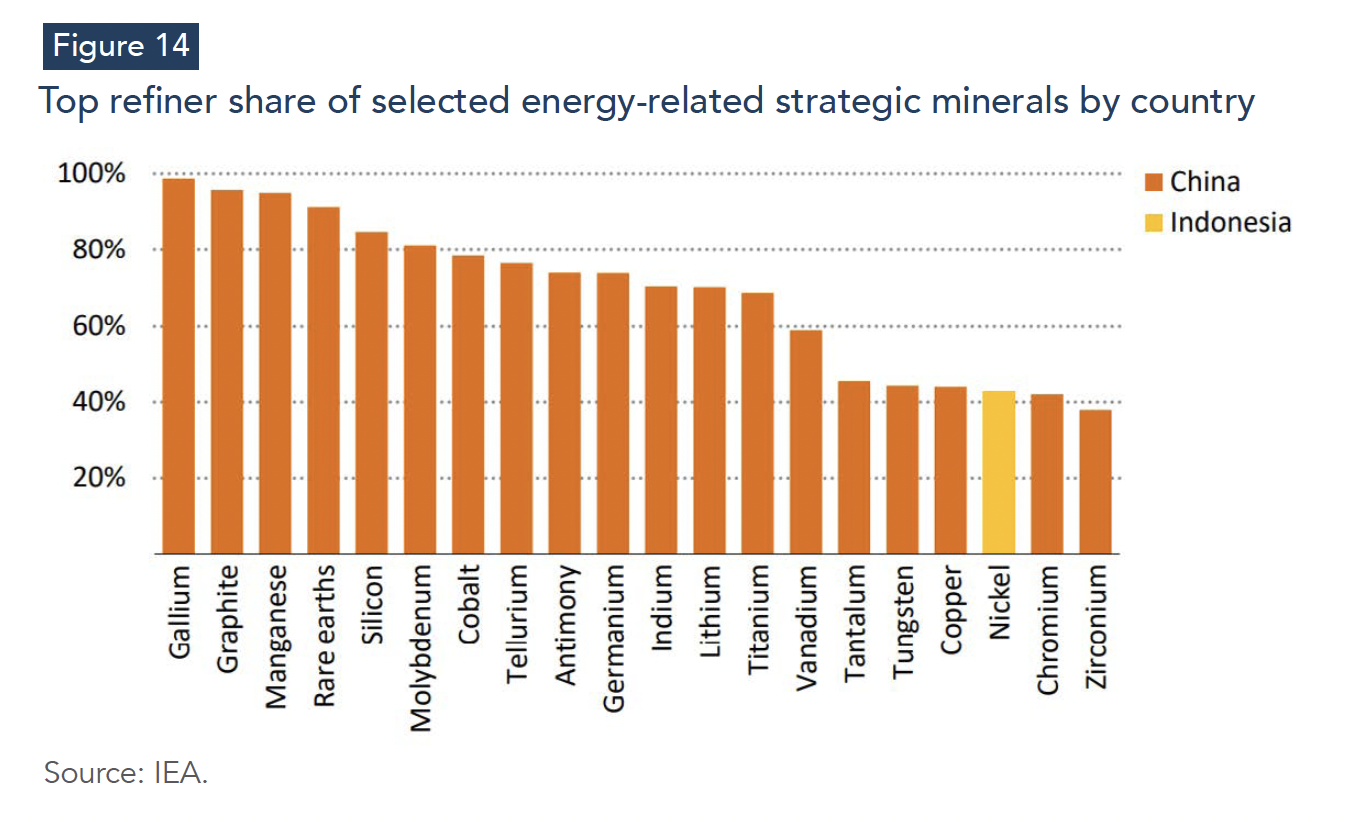
China’s role illustrates the scale of exposure. The IEA reports that China is the dominant refiner for 19 out of 20 energy-related strategic minerals and holds an average refining share of around 70% (IEA, 2025a). In concentrated markets, disruptions, whether triggered by export restrictions, extreme weather, technical failures, or sanctions, can propagate rapidly across multiple industrial chains simultaneously, affecting renewable deployment, grid expansion, battery manufacturing, and AI hardware supply chains. Trade measures can operate as effective chokepoints because substitution options are limited in the short run and alternative refining capacity takes time to develop.
Mining and refining projects remain slow to permit, capital-intensive, and frequently exposed to environmental and social constraints. Supply chains tend to favor incumbents with established infrastructure, scale economies, and cost advantages. Meanwhile, demand for minerals underpinning clean technologies continues to rise faster than supply chains can expand under current investment and permitting constraints (IEA, 2025a; Wood Mackenzie, 2025). In this context, mineral price volatility matters as much as physical availability: swings in lithium, copper, nickel, or rare-earth prices can raise capex uncertainty, lengthen project timelines, and increase financing costs¾even when renewables remain the lowest-cost generation technology on a levelized-cost basis (Wood Mackenzie, 2025; IEA, 2025a).
For 2026, critical minerals are therefore not a question of whether the transition proceeds, but of how fast, at what cost, and with what geopolitical exposure. The transition remains technologically feasible, but its pace will increasingly depend on diversification of refining and processing capacity, faster permitting and investment decisions, and procurement strategies designed to reduce dependence on concentrated supply routes (IEA, 2025a; Wood Mackenzie, 2025).
3.4 Capital: Abundant Investment, Tighter Discipline, and Higher System Costs
The investment environment entering 2026 is not defined by a shortage of capital in aggregate, but by more selective capital deployment under rising uncertainty and higher system costs. The IEA estimates that global capital flows to the energy sector will rise in 2025 to around USD 3.3 trillion, a 2% increase relative to 2024, with roughly USD 2.2 trillion directed toward clean energy technologies (IEA, 2025d). The defining shift is therefore qualitative: investment appetite remains substantial, but investors increasingly prioritize execution certainty, resilience to regulatory and supply-chain risks, and clarity of revenue streams. This raises the effective cost of capital for transition segments where permitting delays, grid access uncertainty, or policy volatility increase project risk, even when the underlying technologies are cost-competitive (Deloitte, 2025).
A first driver is policy and regulatory uncertainty, which shortens compliance timelines, raises documentation requirements, and increases uncertainty over eligibility rules and localization constraints. Shifts in implementation frameworks, including in major markets such as the United States, can compress development schedules and raise compliance costs, prompting developers to reconsider project sequencing and capital deployment strategies (Deloitte, 2025). Even where renewable economics remain attractive, these changes lengthen decision cycles and favor large developers and platforms able to redeploy capital across projects and jurisdictions.
A second driver is the rise in integration and system costs. As grid congestion and slow permitting increasingly constrain new generation, time-to-revenue becomes less predictable. This increases financing costs and raises the premium on bankable contracting structures, predictable interconnection outcomes and robust execution capability (IEA, 2025a). In this environment, capital tends to favor mature assets, hybrid portfolios, and projects located in systems where grid access and permitting outcomes are more predictable.
A third driver is the growing role of resilience and supply-chain risk management as a cost component of investment. Tight markets for transformers, grid components, and selected turbine classes have extended lead times and increased execution risk. Firms increasingly pursue multi-sourcing, vertical partnerships, and inventory buffers to reduce exposure to component bottlenecks. These measures improve robustness, but they also increase the capital intensity of projects and reinforce the paradox that while commodity prices may soften, the investment requirements of the transition do not necessarily fall proportionally (IEA, 2025e; Deloitte, 2025).
Two macro consequences follow for 2026 and beyond. First, the risk of underinvestment rises in segments where social returns exceed private returns, most notably grids, long-duration flexibility, and resilience infrastructure—because these areas often face regulatory complexity and weaker, less bankable revenue models (IEA, 2025e; OECD, 2024). Second, financing asymmetries across regions widen. The gap between economies able to mobilize cheap capital under stable policy frameworks and those facing high financing costs and weaker institutional predictability is increasingly recognized as a binding barrier to scaling clean energy investment in emerging and developing economies (IRENA, 2025; OECD, 2024). This divergence is likely to remain a defining feature of the transition landscape through 2026, shaping both the pace and geography of decarbonization.
4- Outlook for 2026: Lower-Price Baseline, Wider Risk Distribution
The 2026 energy outlook is defined by a dual regime. On average, commodity prices are expected to ease further as supply growth continues to outpace demand growth in oil and coal and as LNG supply expands, extending the disinflationary impulse observed in 2025 (World Bank, 2025; OPEC, 2025). At the same time, the distribution of risks is widening. Price levels are increasingly shaped by producer strategy, policy shocks, and geopolitical events, while macroeconomic exposure is amplified by electricity-system constraints, network bottlenecks, and infrastructure resilience challenges that affect delivered costs and reliability even when input fuels soften (IEA, 2025a; IEA, 2025b). This section, therefore, interprets 2026 not as a return to a low-volatility regime, but as a year of lower expected prices combined with persistent tail risks and asymmetric transmission across fuels and regions.
4.1 Oil: Surplus Baseline, but Policy Shocks Keep the Distribution Wide
The baseline oil outlook for 2026 remains surplus-driven. Under the World Bank’s October 2025 forecast, Brent is projected to average 60 USD/bbl in 2026, down from 67 USD/bbl in 2025, reflecting moderating demand growth and continued supply expansion (World Bank, 2025). This baseline assumes no major escalation in armed conflicts, weak demand growth relative to the 2025-2019 average, and a stable OPEC+ production.
OPEC’s baseline differs in balance accounting but does not contradict the direction of price softness. In its December 2025 Monthly Oil Market Report, OPEC projects global oil demand at 106.5 mb/d in 2026, up from 105.1 mb/d in 2025 (+1.4 mb/d), driven almost entirely by non-OECD consumption (OPEC, 2025). OPEC also expects liquids supply growth to remain concentrated in non-DoC producers (i.e., producers outside the OPEC+ Declaration of Cooperation, including the United States, Brazil and Guyana), which implies that the market continues to rely on producer discipline to avoid excess inventories (OPEC, 2025). The analytical point is that both baselines converge on the same structural configuration: demand growth is no longer strong enough to absorb incremental supply without restraint, making price softness the default outcome unless OPEC+ actively tightens the balance.
The macro transmission channel for 2026 is therefore shaped less by demand growth than by supply policy and price expectations. As surplus baseline implies continued disinflationary effects for importers through transport and fuel costs, it also raises the risk of a renewed cycle of underinvestment if prices stay below breakeven levels for marginal supply addition. The World Bank itself anticipates a partial rebalancing by 2027 as low prices curtail supply growth and support a price recovery (World Bank, 2025). In other words, low prices compress upstream investment incentives, increasing the probability of future volatility rather than eliminating it.
This is why the 2026 oil outlook is best described as downward-biased but fat-tailed. Downside risks are dominated by higher-than-expected OPEC+ output and weaker-than-assumed demand growth under renewed trade tensions (World Bank, 2025). Upside risks, however, remain non-trivial if supply growth falls short due to sustained investment discipline, production constraints, or geopolitical disruptions.
The early January 2026 United States–Venezuela episode illustrates this logic well: market commentary emphasized that the event injected a short-lived risk premium, while traders continued to anchor on surplus conditions given Venezuela’s limited share of global output (Reuters, 2026; Bloomberg, 2026). The implication for 2026 is therefore not a reversal of the baseline, but a widening of uncertainty around it: oil prices are likely to average lower, yet the probability of episodic spikes remains elevated.
4.2 Natural Gas: Divergent Benchmarks Diverge, and Inflation Transmission Remains Asymmetric
Unlike oil, the natural gas outlook for 2026 is governed by regional benchmarks linked imperfectly though LNG trade. Under the World Bank’s baseline, the U.S. benchmark is projected to rise by 11% in 2026 following a sharp increase in 2025, reflecting tighter domestic balances and higher LNG exports. By contrast, the European benchmark is projected to decline by 11% in 2026 after rising in 2025, as demand remains moderate and global LNG availability improves. Japan’s LNG benchmark is expected to broadly track European pricing conditions, reflecting continued competition for flexible LNG cargoes (World Bank, 2025).
The IEA outlook reinforces this baseline through the supply channel. It projects that global LNG supply growth accelerates materially in 2026, driven primarily by new export capacity in North America and by Qatar’s expansion coming online from mid-2026, implying a loosening of international LNG balances relative to 2025 (IEA, 2025f). This supply-driven easing is consistent with downward pressure on European and Asia benchmarks even as global consumption continues to rise.
For 2026, the macroeconomic relevance lies in inflation asymmetry. In importing regions where gas remains pivotal for heating and marginal power pricing, a decline in benchmark prices supports disinflation and eases pressure on industrial margins. In the Unites States, however, continued benchmark strength implies that domestic electricity generators and industrial users remain exposed to persistent fuel-cost pressures, especially as LNG exports tighten the link between domestic supply-demand conditions and global market dynamics (World Bank Group, 2025).
The distribution of risks remains skewed to the upside: conflict-driven disruption, colder-than-normal winter demand, renewed Asian competition for LNG cargoes, and faster-than-expected AI -driven power demand are key channels through which prices could exceed the baseline (World Bank Group, 2025). In this respect, gas remains a central near-term inflation variable less through its annual average price level than through its sensitivity to seasonal volatility and supply shocks.
4.3 Coal: Downward Price Baseline, but Weather and Power-System Dynamics Keep Volatility Relevant
Coal prices are expected to soften further in 2026 under the baseline assumption of subdued global growth and adequate supply conditions. The World Bank projects the Australian benchmark coal price to decline by a further 7% in 2026, following the sharp correction in 2025, before recovering in 2027 (World Bank Group, 2025). This outlook reflects moderating global activity and easing international trade, alongside continued expansion of renewable generation and weakening import demand in parts of Asia.
However, coal’s relevance in 2026 is driven less by long-term demand trends than by short-run interactions between electricity demand, renewable output variability, and fuel-switching incentives. The World Bank notes that coal consumption declined modestly in early 2025, but regional patterns diverged sharply: coal use fell in China and India amid stronger renewable output, increased in the United States as electricity demand rose and natural gas prices remained elevated, and temporarily increased in parts of Europe when renewable generation underperformed (World Bank Group, 2025; S&P Global, 2025b). This underscores that coal retains short-run importance as a residual balancing fuel in systems where renewable variability, hydropower shortfalls, or gas-price dynamics tighten the marginal electricity balances.
The risk distribution for 2026 is broadly balanced but highly weather-sensitive. Upside risks include unexpected increases in coal consumption in China, extreme weather events that raise power demand while constraining hydropower, and stronger-than-expected electricity demand from data centers (World Bank Group, 2025). Downside risks stem from stronger supply conditions and weaker global growth, which would depress both industrial output and electricity demand (World Bank Group, 2025). Coal in 2026 is therefore best characterized as a declining-price commodity with persistent exposure to episodic tightening driven by power-system stress events.
4.4 Electricity: Strong Demand Growth, Rapid Renewables Expansion, and Rising Reliability Exposure
Global electricity demand is projected to remain on a high-growth path through 2026. The IEA projects demand to increase by 3.7% in 2026, keeping growth well above the historical average and pushing global consumption beyond 29,000 TWh (IEA, 2025b). While this represents a moderation from the exceptional surge observed in 2024, the underlying structural drivers remain strong: accelerating electrification, rising cooling demand, and the rapid expansion of large new loads such as data centers.
The generation mix continues to shift decisively toward low-emissions sources. According to the IEA, solar PV and wind are expected to raise their combined share of global electricity generation to nearly 20% by 2026, up from around 15% in 2024 (IEA, 2025b). Over the same period, coal-fired generation is projected to contract by 1.3%, while gas-fired generation continues to grow modestly—also by around 1.3% in 2026—reflecting the persistent need for dispatchable capacity to ensure adequacy and system balancing (IEA, 2025b). Nuclear output is likewise expected to rise further, approaching 3,000 TWh by 2026 (IEA, 2025b).
The central implication for 2026 is that electricity markets face a widening gap between energy availability and system deliverability. As economies become more electrified, power-system reliability failures increasingly carry economy-wide consequences. Recent incidents illustrate the scale of this exposure: a major transmission failure in Chile in February 2025 left nearly the entire country without electricity for roughly 17 hours, while Spain and Portugal experienced a blackout lasting more than 10 hours in April 2025 (IEA, 2025b).
This shifts the macroeconomic risk channel away from fuel-price pass-through alone toward reliability, resilience, and operational adequacy. Even amid lower average commodity prices, electricity systems remain exposed to volatility and disruption where grid constraints, slow connection processes, and insufficient flexibility interact with weather shocks and rising load growth (IEA, 2025a; IEA, 2025b).
Taken together, the 2026 outlook points to lower expected price levels for most fuels, but a more fragile risk environment. Surplus conditions in oil markets and easing coal prices support disinflation, while accelerated LNG supply growth provides relief for key importing regions (World Bank Group, 2025; IEA, 2025e). Yet volatility remains structurally embedded through producers’ strategies, geopolitical developments, and weather-related shocks. At the same time, macroeconomic exposure is increasingly shaped by electricity-system adequacy and resilience rather than by fuel scarcity alone (IEA, 2025a; IEA, 2025b). In this sense, 2026 is less a test of fuel availability than a test of system capacity: the ability of grids, flexibility resources, and supply chains to absorb shocks and accommodate rising electricity demand without reliability losses or abrupt cost surges.
5- Conclusion
The 2025–2026 energy cycle reflects a marked shift in how energy markets translate into macroeconomic risk. In 2025, oil and coal prices eased sharply, contributing to a partial normalization after the shocks of 2021–2023. Under a well-supplied baseline, the World Bank expects a further easing in the global energy price index in 2026 (World Bank Group, 2025). For energy-importing economies, this provides near-term relief through lower fuel and transport costs and improved external balances. However, the macroeconomic relevance of energy in 2026 is no longer defined primarily by the level of commodity prices. It is increasingly determined by the distribution of risks and by energy systems—grids, flexibility resources, and supply chains—to absorb shocks and deliver power reliably.
Across fuels, baseline trajectories are downward or stabilizing, but exposure to asymmetric shocks remains high. In oil, a surplus regime points to lower average prices, yet outcomes remain sensitive to OPEC+ strategy and non-OPEC supply growth, while sanctions, trade tensions, and conflict risks continue to generate episodic risk premia without overturning the underlying surplus logic (World Bank Group, 2025; OPEC, 2025). Gas markets remain structurally fragmented across benchmarks: LNG supply expansion may gradually ease pressure in some importing regions, but weather variability, geopolitical shocks, and demand surprises continue to generate volatility and sustain regional tightness (World Bank Group, 2025). Coal remains on a declining trend, yet retains short-run relevance as a residual balancing fuel under renewable variability and gas-price-driven switching (World Bank Group, 2025). Electricity is the clear outlier: demand growth remains historically high into 2026, driven by electrification, cooling needs, and emerging loads such as data centers, while the binding constraint increasingly lies in grid reinforcement, system flexibility, and resilience (IEA, 2025b).
This shift implies two structural conclusions. First, integration costs are becoming as decisive as generation costs. Even where renewable additions remain strong, delivered electricity prices and reliability outcomes are increasingly shaped by congestion, interconnection delays, balancing needs, and resilience investment—rather than by fuel prices alone. The transition is therefore becoming more capital- and governance-intensive: permitting speed, procurement capacity and regulatory credibility now play a central role in determining both implementation outcomes and macroeconomic exposure (IEA, 2025a). Second, energy security is broadening from fuels to industrial inputs. Critical minerals and key equipment supply chains—particularly in refining and grid components—create new vulnerabilities, as trade restrictions, bottlenecks and geopolitical leverage can slow deployment and raise costs even when clean technologies remain cost-competitive (IEA, 2025a). The core macro risk channel is thus shifting from “price spikes driven by scarcity” toward “constraints arising from infrastructure limits, resilience gaps, and concentrated supply chains.”
For policymakers, this implies that 2026 should not be treated as a return to a low-volatility energy environment. Lower prices may ease inflationary pressure, but they do not eliminate exposure and may foster complacency precisely as system stress intensifies. Three priorities follow from the evidence reviewed in this brief. First, accelerating grid investment and implementation have become a macroeconomic necessity, as congestion and delayed interconnections translate directly into higher delivered costs and greater outage risk (IEA, 2025a; IEA, 2025b). Second, flexibility and resilience must be treated as system goods requiring explicit market and regulatory design, including mechanisms that remunerate dispatchability, storage, and firm capacity, and that embed climate and cyber resilience into planning standards (IEA, 2025a). Third, diversification strategies for critical minerals and equipment supply chains—through partnerships, recycling ecosystems, procurement coordination, and risk-reduction instruments—are increasingly central to transition credibility and cost containment (IEA, 2025a).
Finally, the 2025–2026 outlook highlights a structural asymmetry for emerging and developing economies. While many benefit from lower fuel-price baselines, they face disproportionately high exposure to electricity-system constraints, financing costs, and import dependence for key equipment and refined materials. In this context, the macroeconomic question is not whether the transition proceeds, but how unevenly its costs, vulnerabilities, and strategic advantages are distributed. Addressing this challenge requires shifting policy focus from energy affordability—driven by lower fuel prices—toward energy competitiveness, anchored in system capacity, where grids, reliability, and industrial resilience become the primary determinants of growth and stability in the electrified economy.
References
Bloomberg News (2026) Oil market may absorb Maduro shock as global supplies swell. 3 January. Available at: https://www.bloomberg.com/news/articles/2026-01-03/oil-market-may-absorb-maduro-shock-amid-abundant-global-supplies (Accessed: 8 January 2026).
Deloitte (2025) 2025 Oil and Gas Industry Outlook. Deloitte Insights. Available at: https://www.deloitte.com/us/en/insights/industry/energy-resources-industrials/us-energy-industry-trends.html (Accessed: 8 January 2026).
ENTSO-E (2025) 28 April blackout in Spain and Portugal: Expert panel releases comprehensive factual report, News release, 3 October. Available at: https://www.entsoe.eu/news/2025/10/03/28-april-blackout-in-spain-and-portugal-expert-panel-releases-comprehensive-factual-report/ (Accessed: 8 January 2026).
Gartner (2025) Gartner says electricity demand for data centers to grow 16% in 2025 and double by 2030, Press release, 17 November. Available at: https://www.gartner.com/en/newsroom/press-releases/2025-11-17-gartner-says-electricity-demand-for-data-centers-to-grow-16-percent-in-2025-and-double-by-2030 (Accessed: 8 January 2026).
IMF (2025) World Economic Outlook: October 2025. Washington, DC: International Monetary Fund. Available at: https://www.imf.org/en/publications/weo/issues/2025/10/14/world-economic-outlook-october-2025 (Accessed: 8 January 2026).
International Energy Agency (IEA) (2025a) World Energy Outlook 2025. Paris: IEA. Available at: https://iea.blob.core.windows.net/assets/dfe5daf4-dbc1-4533-abeb-fafb1faee0f9/WorldEnergyOutlook2025.pdf (Accessed: 8 January 2026).
_(2025b) Electricity Mid-Year Update 2025. Paris: IEA. Available at: https://iea.blob.core.windows.net/assets/cc64f0aa-30e4-4497-9cca-1ffae2c55fe5/ElectricityMid-YearUpdate2025.pdf (Accessed: 8 January 2026).
_(2025c) Oil Market Report – December 2025. Paris: IEA. Available at: https://www.iea.org/reports/oil-market-report-december-2025 (Accessed: 8 January 2026).
_(2025d) Energy and AI: World Energy Outlook Special Report. Paris: International Energy Agency. Available at: https://iea.blob.core.windows.net/assets/601eaec9-ba91-4623-819b-4ded331ec9e8/EnergyandAI.pdf(Accessed: 8 January 2026).
_(2025e) World Energy Investment 2025. Paris: International Energy Agency. Available at: https://iea.blob.core.windows.net/assets/1c136349-1c31-4201-9ed7-1a7d532e4306/WorldEnergyInvestment2025.pdf (Accessed: 8 January 2026).
_(2025f) Gas Market Report: Q3 2025. Paris: IEA. Available at: https://www.iea.org/reports/gas-market-report-q3-2025 (Accessed: 8 January 2026).
IRENA (2025) Renewable Power Generation Costs in 2024. Abu Dhabi: International Renewable Energy Agency. Available at: https://www.irena.org/Publications/2025/Jun/Renewable-Power-Generation-Costs-in-2024 (Accessed: 8 January 2026).
OECD (2024) Bridging the clean energy investment gap: Cost of capital in the transition to net-zero emissions, Montague, C., Raiser, K. & Lee, M., OECD Environment Working Papers, No. 245. Paris: OECD Publishing. Available at: https://doi.org/10.1787/1ae47659-en(Accessed: 8 January 2026)
OPEC (2025) Monthly Oil Market Report (December 2025). Vienna: Organization of the Petroleum Exporting Countries. Available at: https://www.opec.org/monthly-oil-market-report.html (Accessed: 8 January 2026).
Reuters (2026) Oil prices forecast to ease in 2026 under pressure from ample supply. 5 January. Available at: https://www.reuters.com/business/energy/oil-prices-forecast-ease-2026-under-pressure-ample-supply-2026-01-05/ (Accessed: 8 January 2026).
S&P Global (2025a) Horizons: Top Cleantech Trends 2026. S&P Global Commodity Insights. Available at: https://www.spglobal.com/energy/en/news-research/special-reports/energy-transition/horizons-top-cleantech-trends-2026 (Accessed: 8 January 2026).
_(2025b) Coal Prices & Data. Available at: https://www.spglobal.com/energy/en/commodity/coal (Accessed: 8 January 2026).
World Bank Group (2025) Commodity Markets Outlook: October 2025. Washington, DC: World Bank. Available at: https://openknowledge.worldbank.org/server/api/core/bitstreams/c579e19c-83a7-4d94-abda-77e4810b4ea4/content (Accessed: 8 January 2026).
[1] Unless otherwise stated, the calculations reported in this section are the author’s own, based on data from the World Bank Group’s Commodity Markets Outlook.
[2] The IEA reports that data center electricity demand is projected to remain below 3% of total global electricity consumption by 2030 in its central scenario.
[3] Negative wholesale electricity prices occur when inflexible supply exceeds demand at a given time and location, and system constraints prevent adjustment through exports, ramp-down, or storage. They are typically associated with high variable renewable generation, limited transmission capacity, and insufficient flexibility (e.g., storage, demand response, or fast-ramping dispatchable capacity). In such conditions, generators may bid below zero to avoid shutdown costs or to preserve eligibility for subsidies and contractual arrangements. While negative prices can signal low marginal energy costs, their increasing frequency is an indicator of congestion and flexibility shortages and can undermine investment incentives by compressing capture prices for renewables and increasing the risk of curtailment.