Publications /
Policy Brief
On the global commodities markets, 2025 largely followed the trajectory set in 2024, with a record rise in precious metals prices against a backdrop of ever-increasing uncertainty, and base metals whose performance was once again largely determined by mining supply levels. On the softs side, cocoa and coffee retreated from past record prices, while the cereals market experienced relative price stability between 2024 and 2025, against a backdrop of abundant harvests worldwide. Oil and gas prices, for their part, have somewhat detached from geopolitical factors and returned to economic fundamentals. With supply plentiful, they ended 2025 on a downward trend, despite a sharp rebound at the end of January 2026 due to a cold start to winter.
While commodities are known to be one of the most powerful barometers of the state of the world, this was not the case in 2025. In this paradoxical situation, oil prices hardly reacted to the major tensions in the Middle East, the intensification of the war in Ukraine, or the American intervention in Venezuela. Gold, on the other hand, reflected this. In a highly unstable economic and political environment, one thing is certain: the world has now fully entered the age of metals. In a race to secure supplies of strategic metals, the United States is now pulling out all the stops to try and catch up with China. Beyond the many crises and conflicts, it is the confirmation of the end of a rule-based international order and the return of spheres of influence that will make 2025 a pivotal year.
In 2025, there was probably much more talk of tariffs and intense geopolitical tensions than, strictly speaking, economic growth or inflation. As a marker of global instability, gold was propelled to the top, with silver in its wake. Oil, gas and grain prices, for their part, largely abandoned this geopolitical component to depend not only on market fundamentals, where supply remained abundant, but also on the expectations of market players.
PRECIOUS METALS AT THE TOP
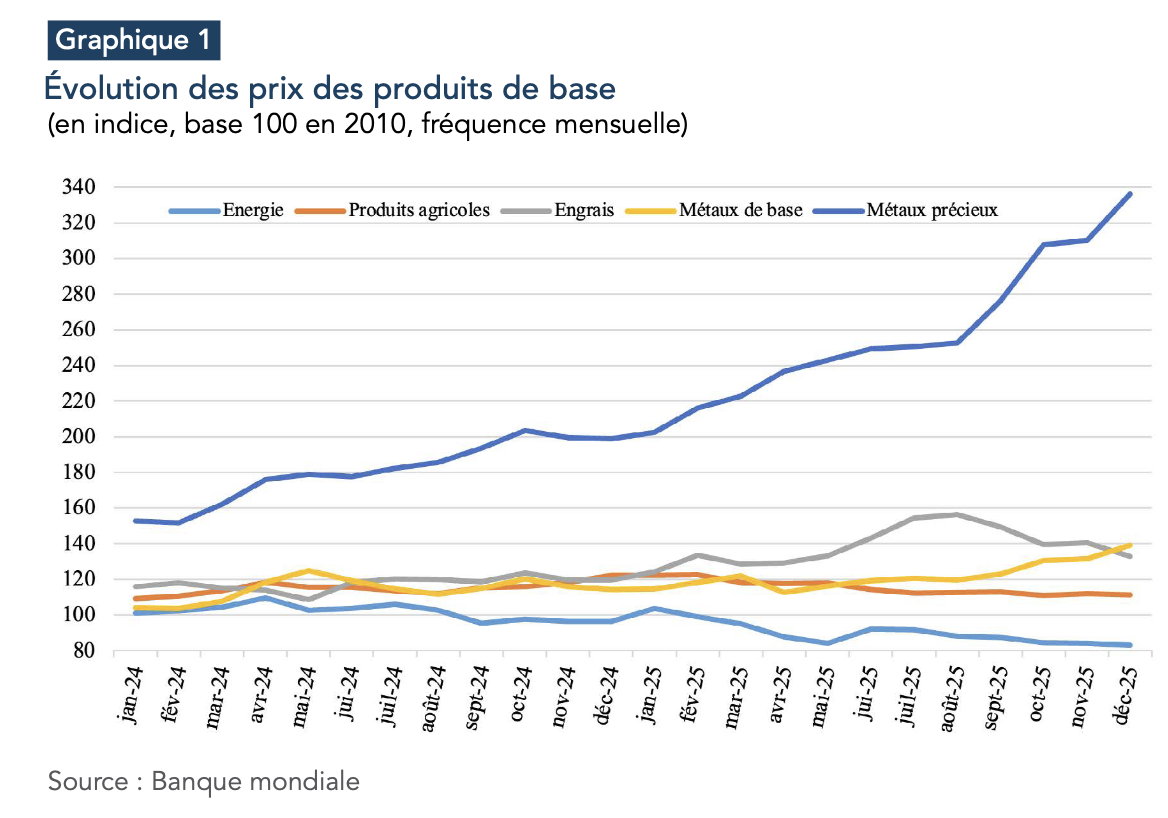
Precious metals prices had already risen sharply in 2024, buoyed by worsening global geopolitical tensions and falling US key interest rates. To the same causes, the same effects: they broke new records in 2025 and in the early days of 2026. Gold, the safe-haven par excellence, rose by an annual average of 44% between 2024 and 2025, placing it at the top of all metals in this respect (graph 1). Between the first and last days of 2025, the ounce gained over 1,000 USD, a 63% surge over the period. By the end of January 2026, it had soared even higher, reaching almost USD 5,278, before pulling back sharply to the USD 5,000 mark.
There are many reasons for this price explosion.The first is undoubtedly the growing uncertainty on the international political scene. American retaliatory trade measures, the offensive in Venezuela, crises in the Middle East, demonstrations in Iran: these have been numerous. However, this recurrence is nothing new, and it is only when combined with other factors that we can understand the record prices of gold and silver. From this point of view, the policy of the US Federal Reserve (Fed) plays an essential role. As a reminder, when global uncertainties mount, there is a massive flight to "risk-free" assets, from traditional U.S. Treasuries to precious metals. When key interest rates are high, the former are favored by investors because they deliver potentially attractive returns. This was the case until the second half of 2023, when, notwithstanding the war in Ukraine or the high tensions in the Middle East, monetary policy acted as a glass ceiling against which precious metal prices (gold and silver) collided. Since then, with expectations of a rate cut, followed by rate cuts that have become more pronounced in 2025 (with three easings initiated in the second half of the year and set to continue into 2026), this limit has disappeared. As the Fed's key interest rate cuts led, all other things being equal, to a depreciation of the dollar, gold purchases in non-US currencies were facilitated and, therefore, stimulated by a form of purchasing power gain under the effect of this exchange rate variation.
However, it's not all about key rates when it comes to US monetary policy and its link to the price of gold. U.S. President Donald Trump's repeated blows against the Fed and its Chairman, Jerome Powell, have indeed fuelled major and legitimate fears about respect for the independence of the U.S. central bank. As is the case for all central banks, this independence is an absolute guarantee that the fight against inflation - abhorred by the markets as synonymous with uncertainty and loss of purchasing power - will remain a priority. Gold also reflected this situation. Reassuring the markets, Donald Trump's announcement that he would appoint Kevin Warsh, a priori a consensus nominee, to head the Fed, was just as much the reason for the sharp fall in prices in the last few days of January 2026. Still on the macroeconomic front, but on the fiscal policy front, global debt levels and uncertainties over the US shutdown (coupled with the polarization of political life in the country) were also not entirely unrelated to investors' pullback in precious metals.
Linked to the previous argument, massive gold purchases by central banks are the third reason for the stratospheric levels of gold prices. According to the World Gold Council1, 863 tonnes were acquired by these monetary authorities in 2025, with Poland, Kazakhstan, Brazil and Azerbaijan among the most dynamic buyers. Although considerable, this amount remains below the record levels reached in 2022 and 2024, at 1,080 tonnes and 1,092.4 tonnes respectively. To understand the evolution of the ounce price, we had to turn to another major category of buyer: Exchange Traded Funds (ETFs), listed index funds whose purpose is to replicate, for their subscribers, the performance of a real or financial asset. In 2025, their net purchases of gold amounted to over 800 tonnes, bringing their total assets in this metal to 4,025 tonnes. More generally, the main motivations for investors in this sector were the prospect of attractive returns and a legitimate portfolio diversification strategy.
Silver also performed very well in 2025. The ounce gained 41%, on annual average, between 2024 and 2025, and 141% between the first and last days of 2025, when it reached $72 on the London market. Its performance has strengthened considerably since then, with silver surpassing the $100/ounce threshold, then $110/ounce at the end of January 2026. Global uncertainties, US policies, investment and speculation: the reasons for this spectacular surge were more or less the same as those for gold, but with two additional factors: a much lower acquisition cost, thus widening the potential demand to "small" investors, and a demand largely driven by industrial sectors, first and foremost photovoltaics.
BASE METALS IN DISPERSED ORDER
The base metals group (aluminum, copper, tin, nickel, lead, zinc) is much more heterogeneous, and has seen a variety of trajectories, albeit generally upward. Having largely disappointed in 2024 (with prices rising "only" by 7.7% between 2023 and 2024, and by 6.9% in 2024, after approaching the USD 11,000/t threshold in May of that year), copper has at last reconciled itself with its largely favorable medium- and long-term fundamentals. On the London market, a tonne of the red metal has thus risen from some 8,685 USD to 12,504 USD over the year 2025, representing an increase of 43% over this period, and 9% between 2024 and 2025 (graph 2). This solid advance continued largely in January 2026, when a new price record was reached, at almost 14,000 USD/t. This surge is fundamentally explained by the combination of a medium-to-long-term horizon in which primary copper resources will be insufficient to meet all the needs of the energy transition (electromobility, renewable energies, power grids) and urbanization, and a short-term reality marked by an imbalance between supply and demand for copper concentrates. In view of this growing demand for the red metal, numerous smelters have been launched, but the supply of concentrates has not kept pace, and for good reason. Copper metallurgy is particularly old, and copper grades in existing mines are declining as a result, while the number of major discoveries is shrinking decade by decade.
This problem was exacerbated in 2025, with the temporary shutdown of several major mines, including Grasberg in Indonesia, which was placed under force majeure in September after a mudslide killed seven workers. From this point of view, the rise in copper prices is not the only trajectory to be considered on this market. Reflecting the balance of power between miners and smelters, TC/RC (Treatment Charges/Refining Charges2 ) have remained low, even negative, indicating a balance of power in favor of the former, to the detriment of the latter. In addition, the imposition of customs duties in the United States on imports of semi-finished copper products from August 1, 2025, created an air pocket in the first half of the year, creating the conditions for a more than proportional rise in prices on the American market.
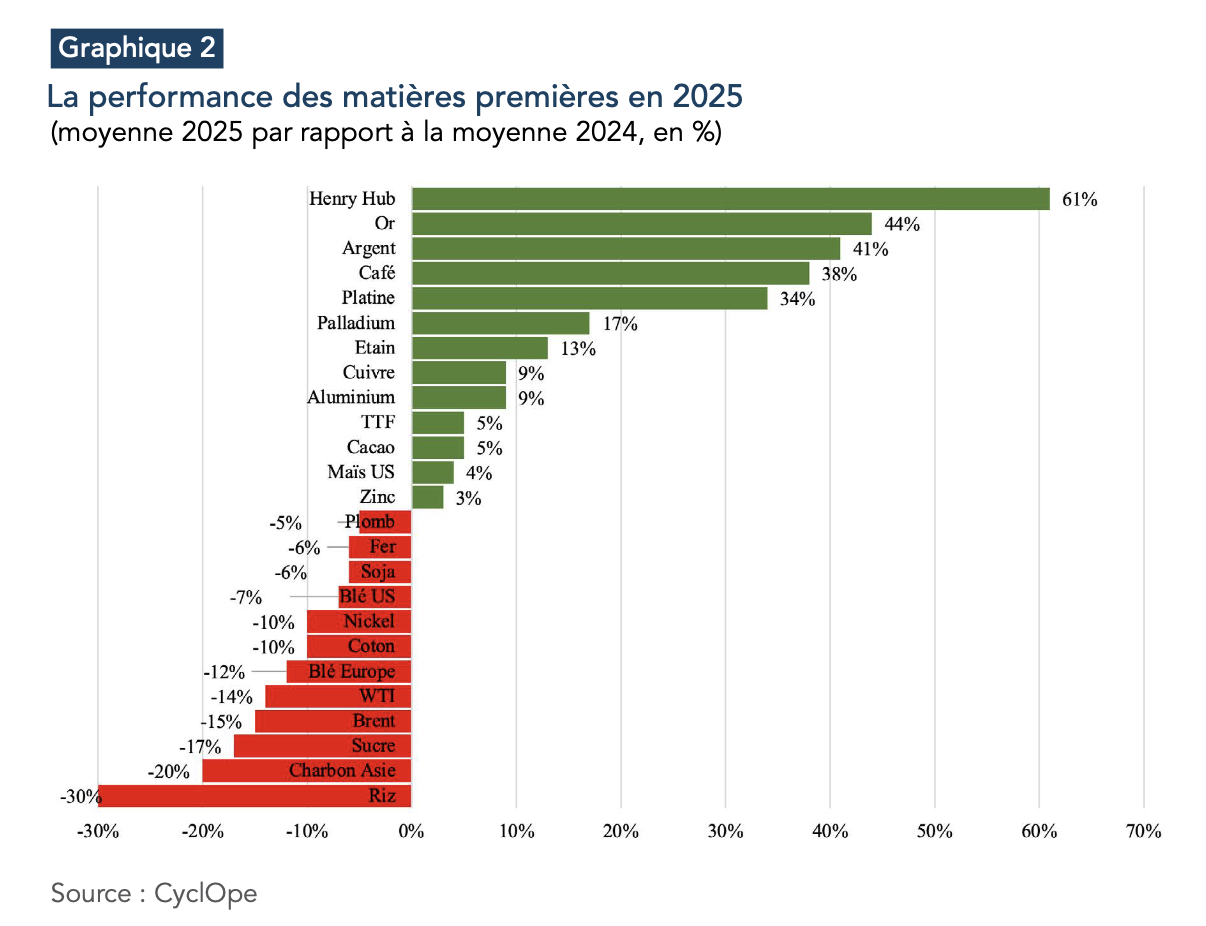
In the very favorable wake of 2024, tin was the other big winner of 2025, with an increase of 13% between 2024 and 2025, and of 45% over 2025, at the end of which a tonne was worth 40,900 USD. Like the metals mentioned above, tin continued its upward march in January 2026, reaching USD 56,600/t on the London market, erasing the previous all-time high of USD 50,050/t set on March 8, 2022. The reasons for this rise were not very different from those of 20243: mining supply was subject to numerous uncertainties (Indonesia, Myanmar, Democratic Republic of Congo), while demand was buoyant, driven by the electronics and photovoltaics sectors. Nickel, on the other hand, has not enjoyed similar fortunes. Drowned out by overcapacity in Indonesia and penalized by sluggish demand for stainless steel, it failed to benefit from the surge in demand for so-called "class 1" nickel, needed to manufacture the cathodes of lithium-ion batteries, of the NMC (Nickel, Manganese, Cobalt) type. On the London Metal Exchange (LME), its price fell by an annual average of 10% between 2024 and 2025. Its 10% rise between January and December 2025 was a false dawn, thanks to a sharp rise in the last few days of December, while the preceding months had seen nickel hovering around USD 15,000/t. Jakarta's announcement of a significant reduction in the country's ore production quotas was the reason for this sharp rise in prices, from USD 14,125/t on December 16 to USD 16,585/t on December 31, before exceeding the USD 18,000/t threshold in mid-January 2026.
OIL UNDER PRESSURE
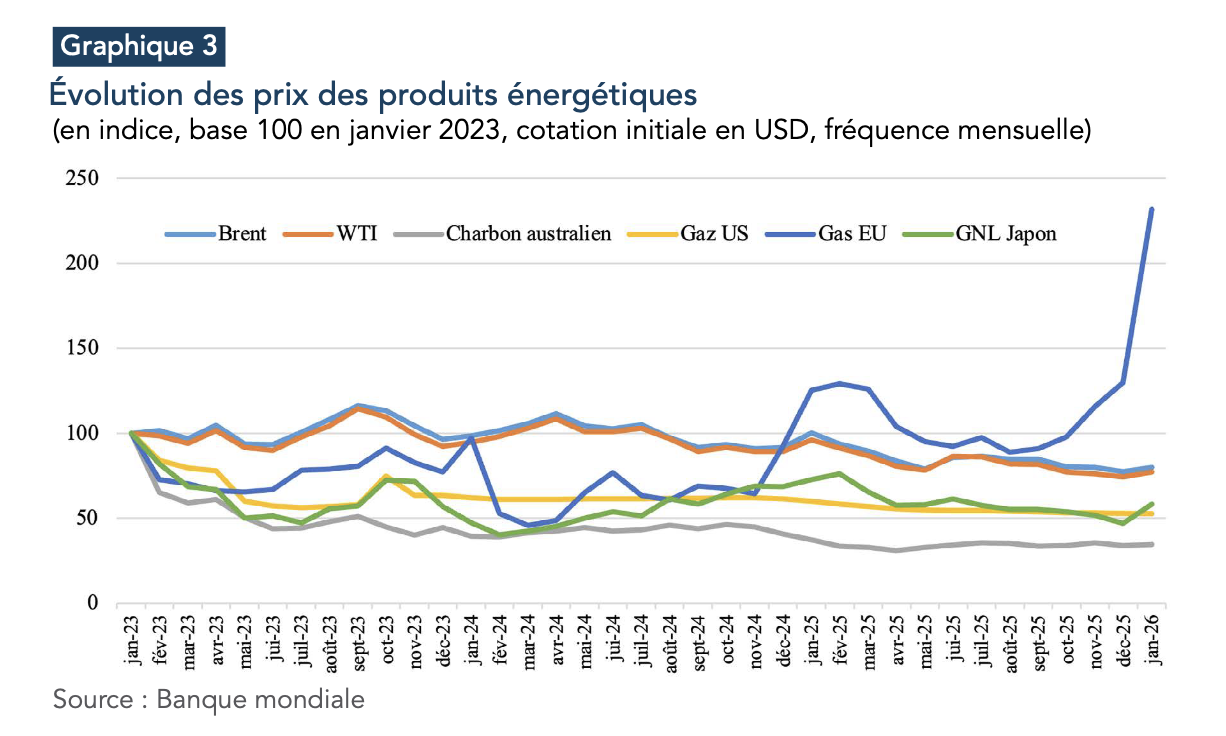
Between 2024 and 2025 (and still on an annual average basis), Brent and West Texas Intermediate prices fell by 15% and 14% respectively. At the end of December 2025, Brent was trading at around USD 61/bbl, compared with USD 76/bbl in the first few days of January this year, a decline of around 20% over the period (graph 3).
This downturn in prices certainly signalled the attenuation of the "geopolitical component" of oil. Thus, although the high tensions in the Middle East and the war in Ukraine may have temporarily bolstered prices, they were unable to reverse this downward trajectory. For example, when the US launched a nuclear attack on Iranian nuclear sites on June 22, Brent rose by "only" 2.4% to USD 79/bbl, despite the risk of the Strait of Hormuz, through which almost 20% of the world's oil transits, being closed.
To understand the price downturn, we had to turn to the fundamentals of supply and demand. Estimated at 106.28 million barrels/day (Mb/d) for 2025, according to the US Energy Information Agency4 , crude oil production was particularly dynamic, especially in the third quarter, when the record threshold of 107 Mb/d was exceeded. This was partly due to production increases decided by OPEC+. On March 3, 2025, the oil alliance reaffirmed its December 2024 decision to phase out voluntary production cutbacks from April 1, 2025. Several increases were recorded during the year: in June (+411,000 barrels/day), August (+548,000 barrels/day), September (+547,000 barrels/day), as well as in the last quarter (+137,000 barrels/day, in October, November and December). This increase in supply offset the effects of a worsening of the conflict in Ukraine, as well as those linked to the intensification of sanctions against Russian oil and the adoption of tariff measures against the countries that buy it, including India.
Demand was down, penalized by negative US growth in the first quarter (-0.6% annualized) and the deleterious effects of US tariff policy on global growth. According to customs statistics compiled by Trade Data Monitor, China's imports have nevertheless risen sharply, from 544.8 Mt in 2024 (equivalent to 4 billion barrels) to 567.2 Mt (4.17 billion barrels) in 2025, an increase of 4.1%.
DIFFERENT GAS PRICE TRENDS
With gas markets still segmented despite the rise of liquefied natural gas (LNG), prices in the USA, Europe and Asia have evolved differently in 2025 than in 2024. Henry Hub, the US gas benchmark, rose by 61% between 2024 and 2025, while Title Transfer Facility (TTF), for continental Europe, and LNG in Asia rose by "only" 9% and 4% respectively (graph 3). However, these statistics only imperfectly reflected the reality of the global gas market, marked by strong growth in LNG production in the wake of previous years. Prices thus fell overall for most of 2025, before rising sharply in the last quarter of 2025 and the first few days of 2026, particularly in Europe, where a harsh start to winter combined with storage levels below historical averages. At the end of January 2026, the TTF exceeded the threshold of 40 EUR per megawatt-hour (MWh), while the Henry Hub reached some 30 USD per million Btu5 at the same time.
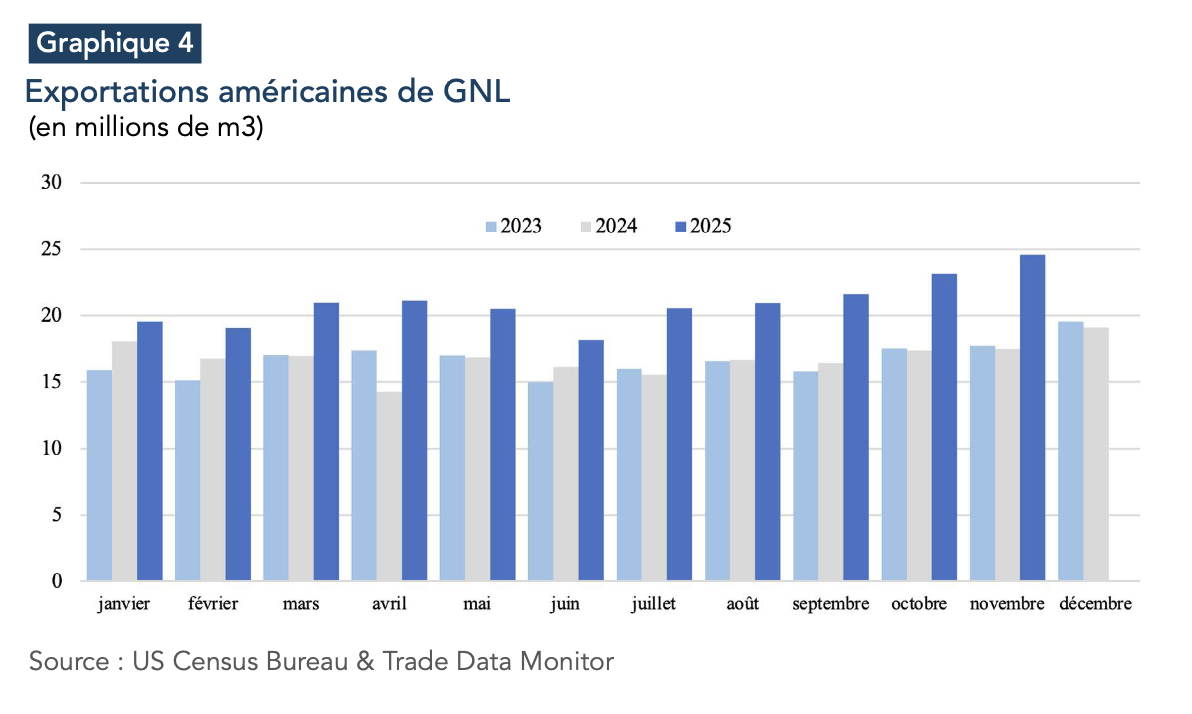
In the case of the USA, a polar vortex affecting a large part of the country led to a sharp increase in gas demand. This proved to be relatively high in 2025, particularly for liquefaction needs, and hence international sales. U.S. LNG exports were indeed substantial, exceeding for each month of 2025 the levels achieved in 2023 and 2024 (graph 4).
BREAKFAST RAW MATERIALS ON THE DECLINE
Between 2023 and 2024, cocoa bean, Robusta and Arabica coffee prices soared by 123%, 68% and 24% respectively. By 2025, this momentum had, unsurprisingly, eased, but these commodities were still on an upward trajectory. On annual average, coffee gained 38% between 2024 and 2025, compared with 5% for cocoa. However, prices fell back month after month in 2025, particularly for cocoa. Between the end of 2024 and the early days of 2025, cocoa prices exceeded 10,000 USD/t, and even 11,000 USD/t, before dropping sharply in February and March and then, after a rebound in May, collapsing heavily over the rest of the year. By December 2025, a tonne was worth "only" 5,900 USD (graph 5). This trend continued in the first few weeks of 2026, with the New York market trading at around 3,700 USD/t and London at 2,600 GBP/t in mid-February.
Several factors explain this downturn. The "destruction of demand", following record price levels. Faced with high supply costs and reduced processing margins, the food industry reduced its purchases and grindings contracted. The postponement of the European Union's deforestation regulation (EUDR) and the announcement that cocoa would be exempt from reciprocal tariffs under US trade policy also improved supply prospects. On the production side, quantities were present, despite the structural problems facing the cocoa industry (ageing, disease). The 2024/25 marketing year, which began in October 2024 and ended in September 2025, showed a supply of 4.98 Mt, according to International Cocoa Organization (ICCO) statistics for November 2025. This represented an increase of 7.6% on the previous campaign, and generated a surplus of around 50,000 tonnes, the first since 2020/21. This rebalancing led logically to an increase in stocks, thus removing the risk of supply tensions and triggering a downturn in prices, which was also fuelled by bearish speculation. According to the ICCO, world stocks could be estimated at 1.112 Mt in September 2025, compared with 1.067 Mt in September 2024. Despite many uncertainties, this surplus situation is also expected to hold true for the 2025/26 campaign, which has also contributed to the fall in prices, the anticipatory component of which is still very much present.
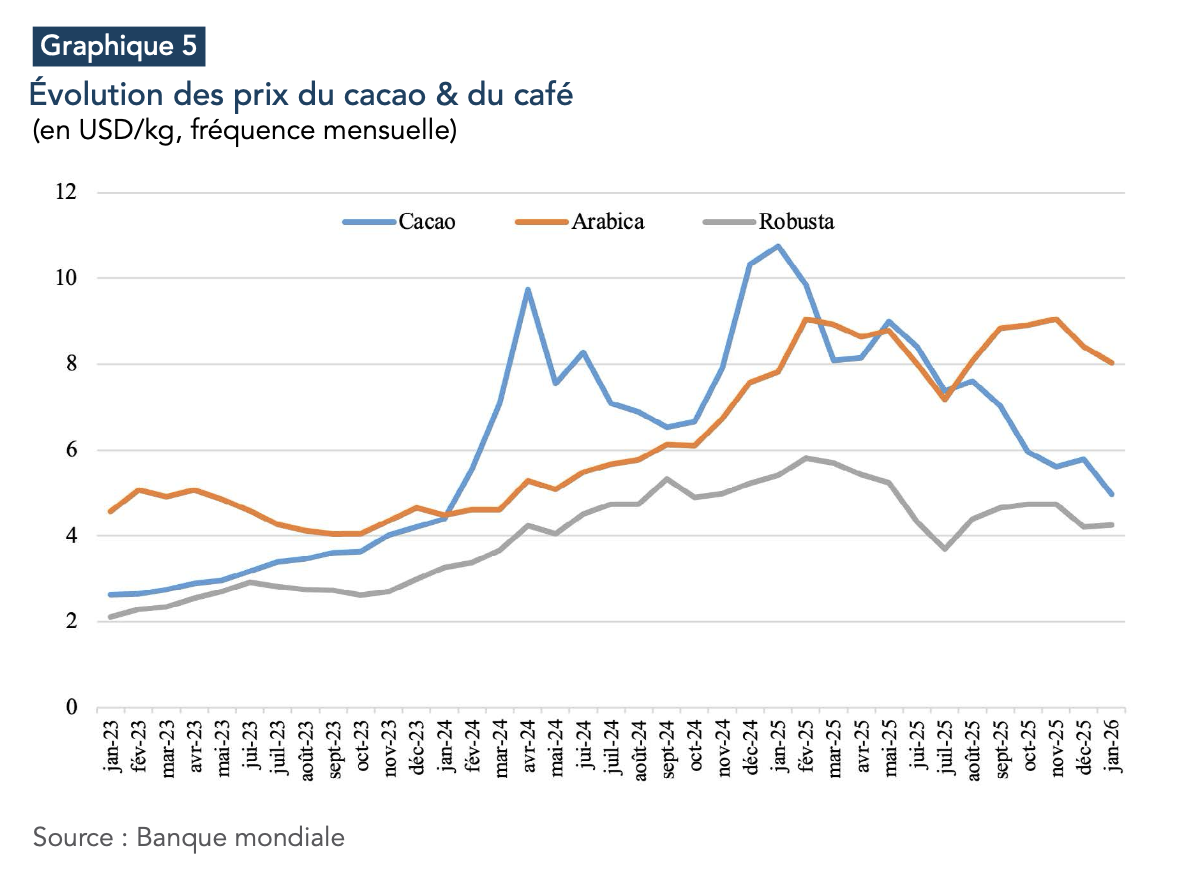
In February 2025, and again during the summer, coffee recorded record prices of over 4 USD/lb. It was therefore logical that prices should rise, on annual average, between 2024 and 2025. Volatility was particularly high during the year, however, with an anticipated drop in volumes in Brazil, the world's leading producer, fuelling bullish speculation and explaining the first price surge, and a combination of factors justifying the second (logistical constraints in Colombia, low stocks on American stock markets, rainfall deficit in Brazil). At the end of 2025 and the beginning of 2026, prices fell back, reflecting the consequences of an a priori abundant supply for the 2025/26 campaign. According to statistics published by the US Department of Agriculture (USDA) in December 2025, production is set to reach a record 178.8 million bags, boosted by historic volumes in Indonesia and a recovery in supply in Vietnam, which should offset declines in Brazil and Colombia. Sugar, for its part, lost 17% between 2024 and 2025, and in February 2026 reached its lowest level since September 2020, at less than 14 USc/lb, against a backdrop of abundant supply and stable demand.
CALMER GRAIN MARKETS
On grain markets, the situation in 2025 was one of relative stabilization, with relatively small variations between 2024 and 2025. While corn prices gained 4% on the Chicago market, soybean prices dropped by 6%. Wheat prices fell by 7% in the United States and 12% in Europe.
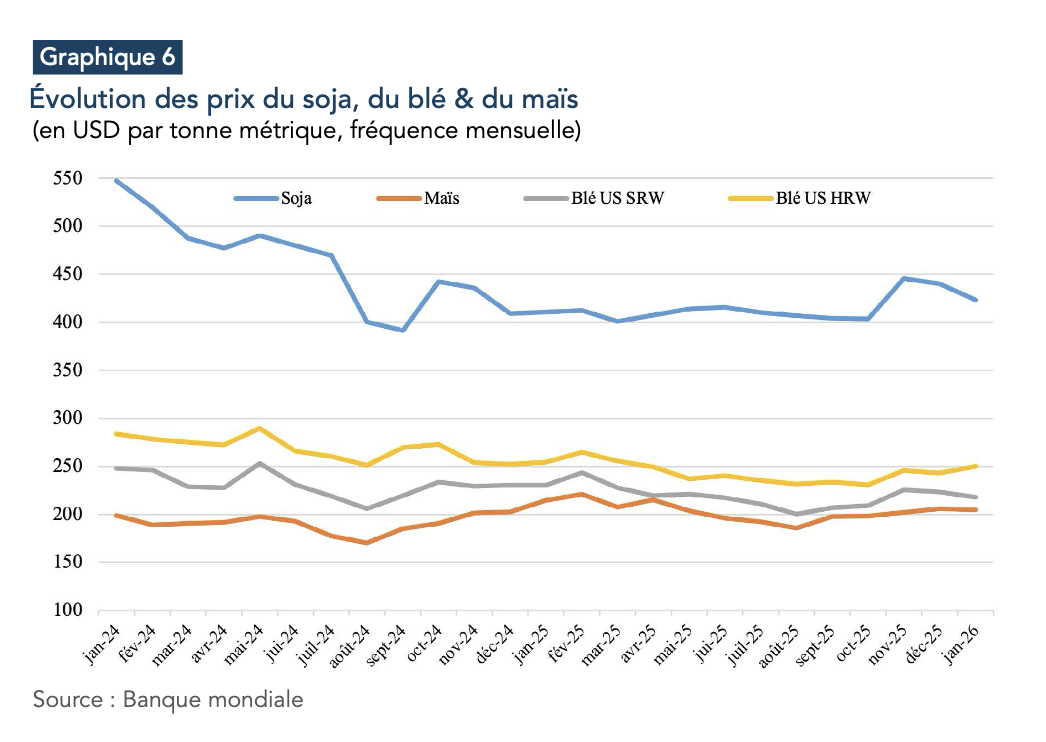
Generally speaking, harvests were abundant, close to the levels of previous years. It was only logical that prices should remain relatively stable. According to the International Grains Council (IGC), available volumes for the 2024/25 campaign can be estimated at 2,328 Mt for all grains, up 0.7% on the previous campaign, while consumption is expected to reach 2,350 Mt (+1.2%). With supply virtually unchanged at 1,237 Mt (+0.2%) and consumption up (+1.5%), the corn market saw a sharp drop in Chinese imports (with a shift to sorghum), notably from Brazil, a sharp decline in Ukrainian volumes, and strong momentum in US exports, which totaled 75 Mt over the first eleven months of 2025, according to the country's customs statistics, compared with 62 Mt for the whole of 2024. Soybeans, meanwhile, were caught in the crossfire of trade tensions between Washington and Beijing. China sharply reduced its imports of American soybeans in the second half of the year, in favor of Argentina. Wheat imports also fell, from 11 Mt to 3.85 Mt, thanks to record domestic production, abundant stocks and import quotas.
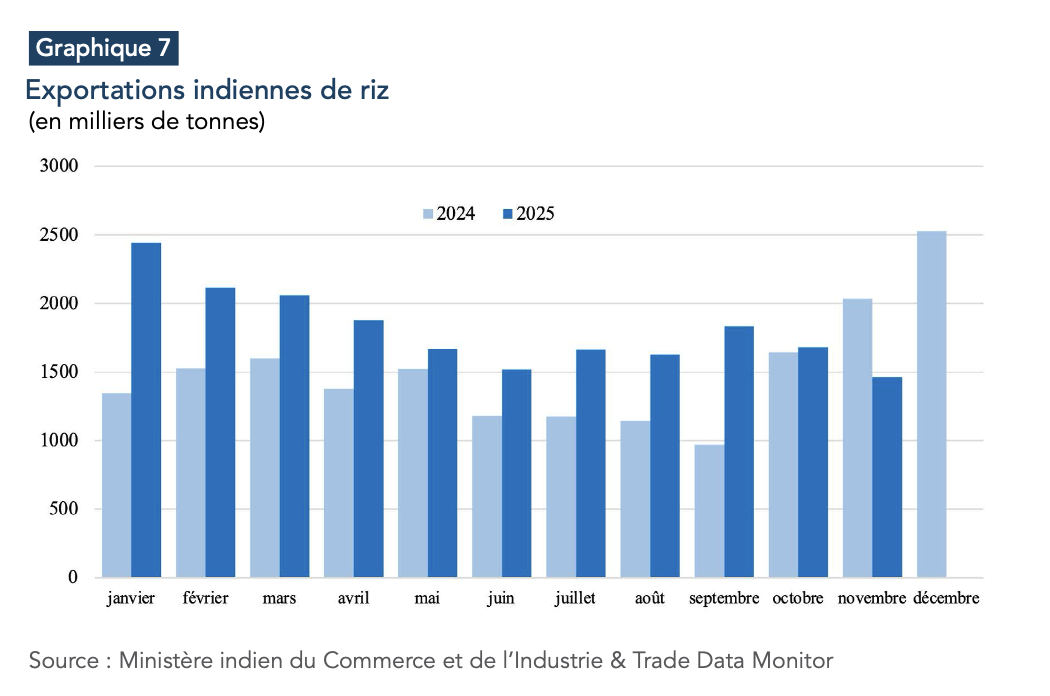
As for rice, the explosion in Indian exports (20 Mt over the first eleven months of 2025, versus 15 Mt in 2024) outweighed the decline in Thai and Pakistani origins. With prices down by around 30% between 2024 and 2025, rice was one of the worst-performing commodities in 2025.
CONCLUSION
With the notable exception of precious metals, certain base metals and a few agricultural products (including edible oils), 2025 ended on a bearish note overall. From oil to cereals, it bore the consequences of relatively abundant production in the face of stable demand. The year 2026 undoubtedly remains dependent on the global macro-economy and the geopolitical scene, and is therefore fraught with profound uncertainties. Global economic growth, expected at 3.3% by the International Monetary Fund, should help maintain demand for industrial raw materials. With the exception of certain metals, such as copper, for which primary supply is structurally constrained, it is production levels that should, as in 2025, determine whether prices rise or fall. As production levels were expected to be abundant (cocoa, coffee, sugar, cotton, cereals, oil, natural gas, iron), 2026 should end with a slight downturn in commodity prices. Extreme caution remains necessary, however, as weather conditions for agricultural products and changes in customs tariffs will once again have a decisive impact on market equilibrium.
[1] World Gold Council: https://www.gold.org
[2] Treatment and refining charges: these are the fees paid by miners to smelters to process concentrate into metal. These are traditionally positive.
[3] For an in-depth analysis of the tin market, the reader may refer to the Policy Paper published in January 2026 on the Policy Center for the New South website: https://www.policycenter.ma/publications/letain-le-metal-strategique-oublie
[4] The agency includes “other liquid hydrocarbons,” notably natural gas liquids (ethane, propane, butane).
[5] British Thermal Unit, the unit used for gas pricing in the United States.