Publications /
Opinion

The IMF released last July 24 its latest assessments of the current account balances for the 30 largest economies in its External Sector Report 2018 (ESR). There was no major change in 2017 relative to previous years and the reconfiguration of surpluses and deficits that has prevailed since 2013 was essentially extended. However, there are reasons to expect more abrupt alterations ahead, as the U.S. fiscal easing under high employment conditions unfolds. Given the context of ongoing U.S.-led trade wars, as well as the recent bout of Chinese exchange rate depreciation, one may wonder about the prospects of currencies also becoming subject to war or rather to what one might call “currency bullying”.
Global current account balances have evolved along a stable configuration since 2013…
Chart 1 depicts the evolution of current account balances of major 30 economies in the period of 1997-2017. After the substantial climb prior to – and its unwinding in the aftermath of - the global financial crisis, the absolute sum of surpluses and deficits has remained close to 3.25% of global GDP (the peculiarities of the first phase are approached in Canuto (2017).
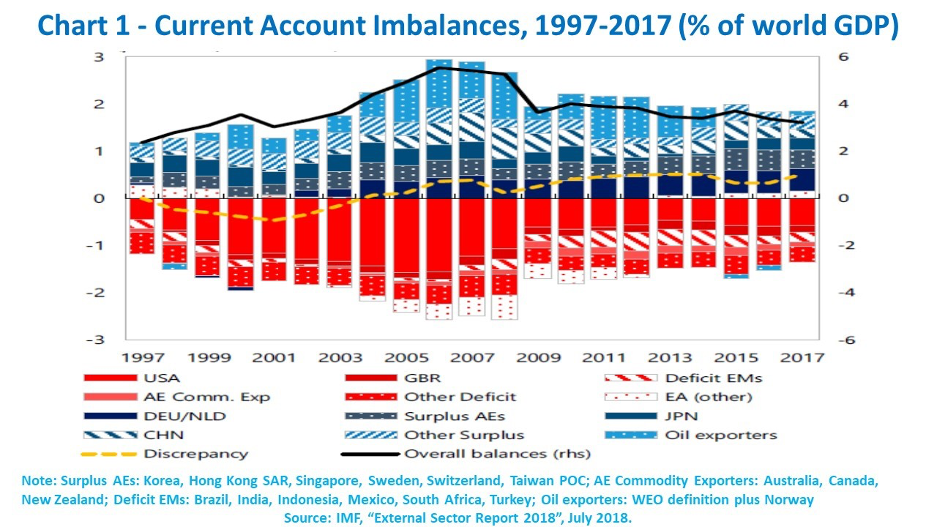
The overall stable landscape featured changes in composition. More recently, China’s current account surpluses have gradually diminished, while Japan, euro area debtor countries and oil-exporting countries have moved in the opposite direction. Below the line, in the case of deficit countries, while the U.S. stayed as the major case, emerging market economies have displayed divergent trajectories: Brazil, India, Indonesia, Mexico and South Africa have left the “fragile” position of the “taper tantrum” in 2013, while Argentina joined Turkey in that zone (Canuto, 2013) (Canuto, 2018).
Asymmetric macroeconomic policy stances among advanced economies since 2013 have also affected the evolution of balances. While some economies have combined large surpluses and weak domestic demand (e.g., Germany, Japan, Netherlands), United Kingdom and United States exhibited stronger recoveries in their domestic demands.
In the case of the U.S., the expansionary effects of last year’s tax cuts have already started to appear in the GDP figures of the second quarter. Although accompanied by a surge in exports, to some extent reflecting anticipation of sales abroad for fear of trade wars becoming fiercer, the U.S. current account deficit is poised to rise.
Stock positions of countries in terms of net international investments evolve according to previous current account balances and the corresponding valuation of assets. Those stocks, in turn, are also among factors determining future current account balances (Alberola et al, 2018). In 2017, valuation effects – including from U.S. dollar weakening - led to a stability of global stock positions (IMF, 2018).
… while real effective exchange rate (REER) and current account gaps have remained significant…
National economies are not expected to exhibit zero current-account balances and stocks of net foreign assets. At any period, domestic absorption – consumption and investment – can be larger or smaller than the local GDP, triggering inflows or outflows of capital, due to “fundamental” factors (Canuto, 2017):
(i) Differences in intertemporal preferences and age structures of their populations mean different ratios of domestic consumption to GDP;
(ii) Differences in opportunities for investment also tend to lead to capital flows;
(iii) Differences in institutional development levels, reserve currency statuses and other idiosyncratic features also generate capital flows and imbalances;
(iv) Cyclical factors – including fluctuations in commodity prices – may also cause transitory increases and declines in balances; and
(v) As referred above, countries’ outstanding stocks of net foreign assets also have a counterpart in terms of service payments in their current accounts.
When global imbalances – and corresponding real effective exchange rates (REERs) - reflect such fundamentals, economies are in a better place than they would be in autarky (isolated with zero balances). There are situations, however, in which such imbalances may be gauged as in excess with respect to notional values suggested by fundamentals.
The IMF External Sector Report has now for six years offered assessments comparing actual current account balances - and REERs - with those that would reflect medium-term fundamentals and desired policies. Chart 2 shows the evolution of current account gaps in 2012-2017, where stronger (weaker) means that a current account balance is larger (smaller) than that “consistent with fundamentals and desirable policies”.
Last year, Germany, the Netherlands, Singapore and Thailand (“substantially stronger”); Malaysia (“stronger”); and China, Korea and Sweden (“moderately stronger), held current account gaps above 4, between 2 and 4, and between 1 and 2 percentage points of GDP, respectively. The euro area was also “moderately stronger,” moving up from the alignment of previous years.
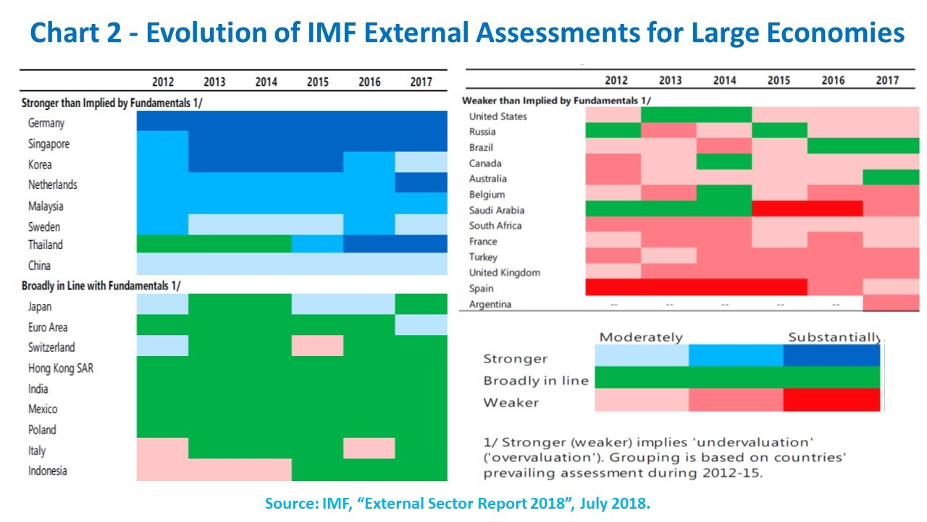
On the other side, Argentina, Belgium, Saudi Arabia, Turkey and the United Kingdom (“weaker”); and Canada, France, Russia, South Africa, Spain and the U.S. (“moderately weaker”), showed negative current account gaps in the ranges of 2-4 and 1-2 percentage points of GDP, respectively. Within the euro zone, large positive gaps (Germany, Netherlands) have co-lived asymmetrically with negative gaps (Belgium, France, Spain), and the euro zone as a whole moved to a positive gap because of shrinking negative gaps in France, Italy and Spain. Notice the absence last year of “substantially weaker” cases. As one might expect, REER and current account assessments, according to the IMF report, are closely linked to each other.
… and the U.S. Treasury is scheduled to present the next FX report in October
Next October, the U.S. Treasury will report again to Congress on “macroeconomic and foreign exchange policies of major trading partners of the United States” (last time was April). A country may be named a “currency manipulator” according to three criteria, besides being considered a major U.S. trading partner: certain levels of bilateral trade surplus with the U.S., overall current account surplus, and one-sided foreign exchange interventions geared at maintaining depreciation. Japan (1988), Taiwan (China) (1988 and 1992), and China (1992-1994) have ben previous cases of such denomination.
In case a country is considered as crossing the 3 lines and is labeled as “currency manipulator”, down the road there may be consequences as denial of access to the U.S. government procurement, the USTR taking it into account in bilateral or regional agreements, and others. There are no countries currently named as “currency manipulators”, but China, Japan, Korea, Germany, India, and Switzerland comprise the current “monitoring list” because they are classified as fulfilling 1 or 2 of those criteria. There are hints that this watch list might be increased, although analysts are not expecting any labeling of “currency manipulator” in this forthcoming report – the application of previously used thresholds does not point to any country crossing all three fault lines.
The Chinese Renminbi has depreciated sharply in recent weeks, partially reversing the course of appreciation that started mid-2007. The IIF (2018) alludes to a possibility that Chinese authorities might be adopting a “neglect” stance as a signal amid the ongoing trade battles with the Trump government, but also highlights risks of substantial capital outflows being triggered with corresponding shocks on China’s financial markets and elsewhere in the world, including global risk assets. The possibility of mutually damaging financial effects between U.S. and China might impose some limits to the “currency bullying” as a proxy to the trade war. Furthermore, as we saw, the U.S. Treasury is not likely to name China as a “currency manipulator”. Nonetheless, rhetoric and “currency bullying” are likely to remain loud as the U.S. trade and current account deficits rise ahead and global imbalances aggravate.