Publications /
Policy Brief
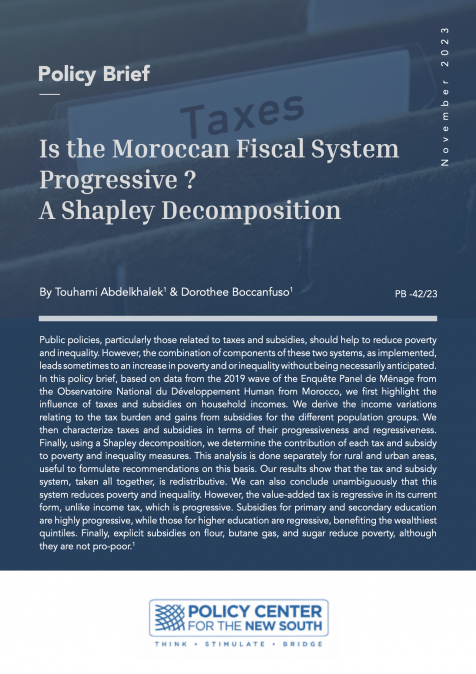
Public policies, particularly those related to taxes and subsidies, should help to reduce poverty and inequality. However, the combination of components of these two systems, as implemented, leads sometimes to an increase in poverty and or inequality without being necessarily anticipated.
In this policy brief, based on data from the 2019 wave of the Enquête Panel de Ménage from the Observatoire National du Développement Human from Morocco, we first highlight the influence of taxes and subsidies on household incomes. We derive the income variations relating to the tax burden and gains from subsidies for the different population groups. We then characterize taxes and subsidies in terms of their progressiveness and regressiveness.
Finally, using a Shapley decomposition, we determine the contribution of each tax and subsidy to poverty and inequality measures. This analysis is done separately for rural and urban areas, useful to formulate recommendations on this basis. Our results show that the tax and subsidy system, taken all together, is redistributive. We can also conclude unambiguously that this system reduces poverty and inequality. However, the value-added tax is regressive in its current form, unlike income tax, which is progressive.
Subsidies for primary and secondary education are highly progressive, while those for higher education are regressive, benefiting the wealthiest quintiles.
Finally, explicit subsidies on flour, butane gas, and sugar reduce poverty, although they are not pro-poor.1
1 Introduction
One of the main social and economic roles of governments is to improve and maintain the standard of living of their populations. To do this, they aim to put in place e cient redistribution systems. These are based on direct and indirect taxation combined with systems of subsidies and cash transfers designed to provide the population with totally or partially free public services (e.g. education and health). However, the overall e ectiveness of these systems in ghting poverty and reducing inequality is neither guaranteed nor proven. Indeed, some combinations of all the components of these systems could even increase poverty and/or deepen inequality.
Lustig and Higgins (2012) showed that increasing public spending is neither certain, nor necessarily e cient, nor su cient to reduce poverty and inequality. From this literature, it appears that, at least at the theoretical level, an exhaustive diagnosis of the situation must be done before any tax reform is carried out, or any analysis of its impact on the population. This is precisely what we're doing here.
Morocco during the 1980s undertook a major reform of its scal system. Its objective was to develop a modern, coherent, e cient, and more universal scal system. Since then, several measures have been introduced through successive nance laws.2 During the Third National Assises of Fiscality, held in May 2019, the reform of value added tax (VAT) was on the agenda. Furthermore, during the drafting of each Finance Law and during the sessions of the Social Dialogue between the di erent partners, this reform as well as that of the income tax (IT) are discussed systematically alongside the adoption of some small measures. Moreover, the reform of the social protection system has become a national priority for the country. This has been recognized at the highest level of the Moroccan government, which considers that the social protection system is an e ective way of ghting poverty and improving the living conditions of the most vulnerable households.
In Morocco, the two principal taxes supported directly or indirectly by households are IT and VAT. The IT is based on progressive rates ranging from 0% to 38% applicable to annual income of individuals. VAT, meanwhile, is a major indirect tax that came into operation in Morocco in 1986. It generates the most tax revenue for the government. In 2019, the VAT rates applied in Morocco were 0% for some basic goods, 7%, 10%, 14%, and 20%.
In terms of subsidies, to ght poverty and reduce inequality, Morocco has implemented social policies based on direct and indirect transfers. A compensation system has been set up to maintain the prices of some commodities at given levels through subsidies. The latter aim to limit price rises and thereby preserve the purchasing power of the population. For subsidies to primary, secondary and higher education, as well as to healthcare, we have consulted the o cial reports published by the relevant government departments.
We then examine the e ectiveness of scal policy in Morocco and characterize its progressiveness and its pro-poor nature, updating and enhancing the research of Abdelkhalek and Ejjanoui (2018) and Ehrhart et al. (2020) and by exploiting the 2019 wave of the Enquête Panel de Ménage (EPM) from the Observatoire National du Développement Humain(ONDH). For urban and rural areas, we assess the impacts of di erent tax components (taxes and subsidies) on the variation in welfare measures (poverty and inequality) between two incomes (Market and Observed) using the Shapley decomposition method developed by Shorrocks et al. (2013) and implemented by Azevedo et al. (2012).
2 Methodology, Data and Implementation
We adapt the approach elaborated in the Commitment to Equity Assessment (CEQ) project (Lustig and Higgins, 2012).3 In addition, we complete the analysis using well-known poverty, inequality, and incidence approaches. This methodology has been adapted to assess taxation and public expenditure systems and their impacts on poverty and inequality. Figure 1 shows the identi cation of each of the income measures needed to analyze the contribution of taxation in Morocco, based on the method developed by Lustig and Higgins (2012) and adapted by Abdelkhalek and Ejjanoui (2018).
To evaluate if the distributive impact of a scal policy (taxes or transfers) is progressive, we use concentration curves and indices. The best known is that of Kakwani (1977). In this literature, the terms 'progressive' and 'regressive' are used in di erent ways for taxes and transfers. The progressive or regressive nature of a transfer or tax can rst be measured in absolute terms. This involves comparing the values of that transfer or tax across quantiles of the population. This concept can also be approached in relative terms. In this case, the transfers or taxes are compared as a percentage of income (before taxes or transfers) for each quantile of the population. To strengthen our analysis, we consider the concepts of progressiveness in both absolute and relative terms.
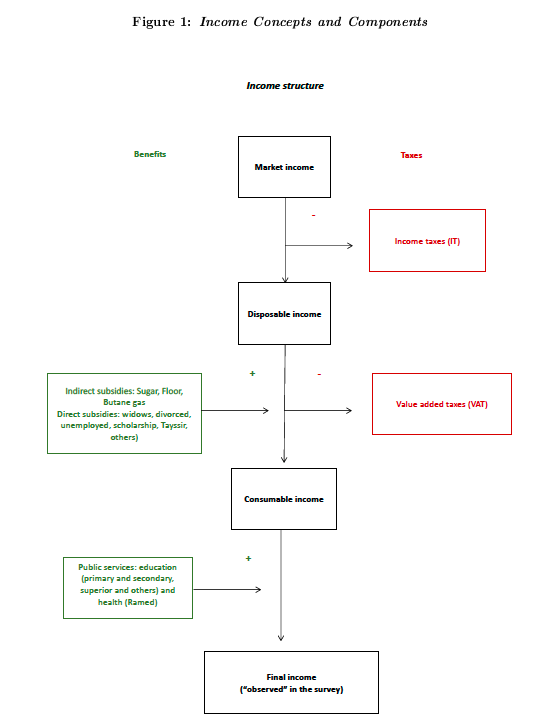
Source: Adapted from Lustig and Higgins (2012) and Abdelkhalek and Ejjanoui (2018).
Furthermore, since the 1990s, an abundant literature has been produced on the decomposition into component parts of economic phenomena, such as poverty and inequality. Several authors have developed a decomposition method based on the Shapley value (Shapley, 1953). 4 This involves measuring the marginal e ect of the successive elimination of each component taken one by one. Since the order in which each component is eliminated is multiple and can in uence the result (pathdependence principle), the method consists of computing the average of all possible combinations of eliminations. This average is then interpreted as the contribution of each component to the indicator of interest.
Based on this approach, we decompose the variable of interest, i.e. nal (or observed) income, into market income and all other components (taxes and subsidies). Next, we identify the marginal contributions of each component, using Shapley's method, to the transition of poverty and inequality measures between Market income and Observed income prevailing in 2019, based on the fth wave of the 2019 Enquête Panel de Ménage (EPM) from the Observatoire National du Développement Humain (ONDH). The extensive information contained in this survey allowed us to conduct the analysis proposed in this article according to the methodology chosen. 5
To implement the methodology, we construct all the variables of interest. First, the di erent income components, particularly those subject to income tax (IT), are identi ed for each household member. In addition, we have built a bridge between the o cial nomenclature of products and services and the goods covered by the ONDH survey (around 1,300 products). This enabled us to deduct the value-added tax (VAT) paid by households on the basis of the 2019 VAT rates. Similar work is done for subsidies for subsidized products. With regard to education-related subsidies, we di erentiated between primary and secondary levels, higher education and, nally, other subsidies indirectly linked to education. For these latter subsidies, inspired by Ehrhart et al. (2020), we retained the Tayssir program, school canteens and school transport, internships and the "Un million de cartables" program.
On the same principle, for health-related subsidies, we considered the annual budget of the RAMED program in relation to the number of members in the same year, and allocated this amount to the households in the survey that declared they had a RAMED card. Once the treatments have been completed, we obtain, in addition to Observed income, three other types of income: Consumable income, Disposable income and Market income. Finally, the decomposition is based on eight components (taxes and subsidies).
3 Results and Discussion
In terms of inequality, taxes and subsidies are progressive as expected, whatever the index chosen (Table 1). Income taxes have a greater redistributive impact in urban areas, while subsidies have a greater e ect in rural areas. For example, subsidies for public services (health and education) reduce the Gini index (Resp. Theil) by 27.76% (Resp. 36.37%) in rural areas, versus only 11.65% (Resp. 11.88%) in urban areas (variation between Observed income and Consumable income in the Figure 1). We also note that the e ects of VAT and indirect subsidies (change from Disposable income to Consumable income) are weaker than those associated with public services. We can already clearly see the important redistributive role of education and health subsidies.
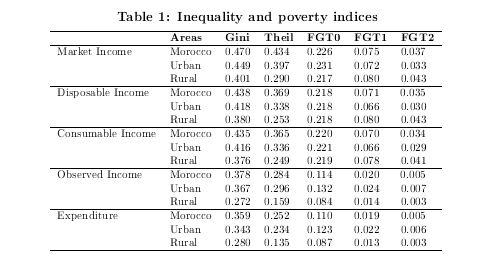
Source: Authors from EPM 2019. FGTs are Foster et al. (1984) indices. FGT0 is the poverty incidence, FGT1, the depth and FGT2 the severity of poverty.
With regard to poverty, we again observe a reduction in poverty at national level, as well as in urban and rural areas (Table 1). This reduction is mainly observed between Consumable income and Observed income. For example, subsidies for health and education reduce the incidence of poverty by over 60% in rural areas (−61.46%) and by 40.51% in urban areas. In terms of taxes, VAT unsurprisingly leads to an increase in poverty (change between Disposable income and Consumable income). However, Table 2 shows that the poorest pay less VAT, since it is directly linked to quantities consumed, which are lower for the poor. Income taxes also increase poverty, but only in rural areas. This increase remains low, which can be explained by the fact that rural households paying income tax are not poor households. Here again, Table 2 con rms that over 50% of the poorest rural households do not pay income tax.
For urban households, we see a slight drop in the incidence of poverty following the introduction of income tax. This surprising result is explained by the fact that in this study, the poverty line used is a relative one. At a constant poverty line, IT reduces incomes, implying an increase in the incidence of poverty. However, the shift in the income distribution leads to a reduction in the mean and median, and therefore in the relative poverty line considered. Thus, in the case of urban households, the fall in the relative poverty line is greater than the rise in the incidence of poverty associated with the income tax introduction.
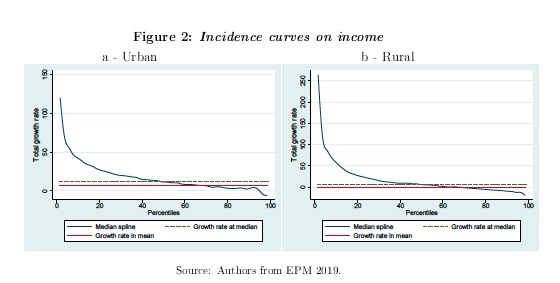
Futhermore, we conduct an incidence analysis of the Moroccan tax system, assessing its pro-poor character using the concept of incidence curves introduced by Ravallion and Chen (2003). These curves show, for both areas, that the system is clearly pro-poor in the sense of Ravallion and Chen (2003), since almost everyone wins (Figure 2). We also conclude that this system is propoor in relative terms in the sense of de Kakwani et al. (2000) with clearly decreasing incidence curves. Indeed, Figure 2-a shows that in urban areas, the poorest half of the population saw their incomes rise by more than the average for the population as a whole, with growth rates of over 25% for the poorest quintile. In rural areas, slightly more than the poorest 40% earned more than the average increase, again with growth rates in excess of 25% for the poorest quintile (Figure 2-b).
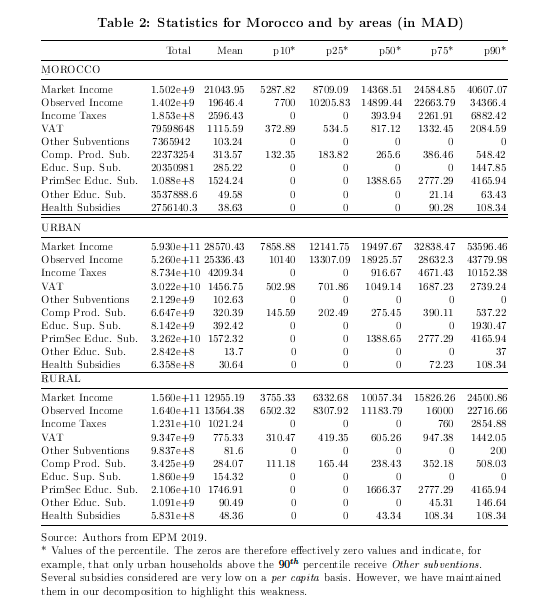
After con rming the progressive role of taxation and budgetary measures in force in Morocco, we now determine the contribution of each considered tax and subsidy to poverty and inequality measures between the Market income and the Observed income. We nd that over a quarter of Moroccans pay no income tax. In rural areas, more than 50% of the population is exempt. This con rm that the IT is progressive, since as the level of Observed income increases, so does the share of that income paid in IT. Indeed, the share paid by the rst quintile of the Observed income distribution of total income taxes is 1.43%, while the wealthiest 20% pay more than 60% of government revenues from this tax.
The results for value-added tax (VAT) are di erent. All Moroccans pay such taxes (Table 2).
As expected, people living in urban areas pay more VAT than those in rural areas. Moreover, the latter bene t less from compensation on subsidized products than urban households. We nd that VAT accounts for between 5% and 6% of nal household income, whatever the quintile or area. In contrast, the poorest 20% of Moroccans pay 8.06% of the total value of VAT paid in Morocco. In urban areas, the top quintile of individuals pay only 2.97% of the VAT collected in the cities. The poorest 20% of rural households pay one- fth (20.79%) of the VAT paid by all rural households, as do the other quintiles.
In terms of school subsidies, we note that those associated with primary and secondary education do not a ect individuals in the same way as those corresponding to higher education. On average, people living in rural areas receive per capita more school subsidies for primary education than those living in urban areas (1, 746.91 MAD versus 1, 572.32 MAD). We observe the opposite for higher education subsidies, with an average of 392.42 MAD for urban households compared to 154.32 MAD in rural areas. Other education-related subsidies also target rural areas more than urban ones. This arises from the government's e orts to combat school drop-out rates in rural primary schools, and initiatives such as the Tayssir program. In terms of progressivity, subsidies for primary and secondary education represent a larger share for the rst quintile of the Observed income distribution (28.02%) for Morocco. This share decreases to just 1.63% for the richest individuals (quintile 5). In rural areas, the poorest receive 44.27% of the total subsidy paid by the government, while in urban areas, quintiles 2 and 3 receive almost 50% of the subsidy paid in the cities. On the other hand, the share of subsidies for higher education is more or less the same for all quintiles across the country (between 1.07% and 1.85%). Finally, unlike the subsidy for primary and secondary education, we nd that the subsidy for higher education is regressive across Morocco and in urban areas, since the higher the Observed income, the higher the share of the subsidy received. In rural areas, the subsidy appears to be neither regressive nor progressive. Furthermore, the health subsidy remains marginal, averaging 38.63 MAD per capita in Morocco, only slightly higher in rural areas (48.36 MAD) and lower in urban areas (30.64 MAD) (Table 2)
In addition, we note that that the share of this subsidy is very low for all quintiles, and virtually nil for quintile 5. Identical results were obtained for urban and rural areas. In terms of progressiveness, the results show that this subsidy is progressive, since once again it is the poorest who bene t most, with 34.56% of the subsidy going to the poorest 20% of the population, while only 6.6% goes to the richest quintile. This result can also be observed in rural areas, where 43.92% of the health subsidy is redistributed to quintile 1. In urban areas, however, this subsidy appears to be regressive, with the exception of quintile 5, which receives only 10.38% of the subsidy. All these results corroborate with the idea that the wealthiest would probably make greater use of the private healthcare system in Morocco.
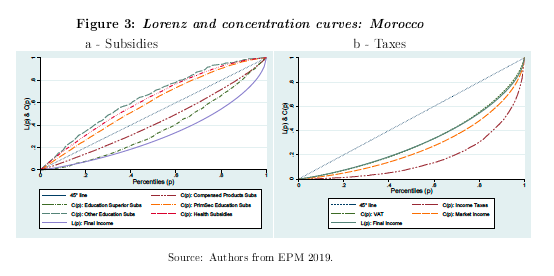
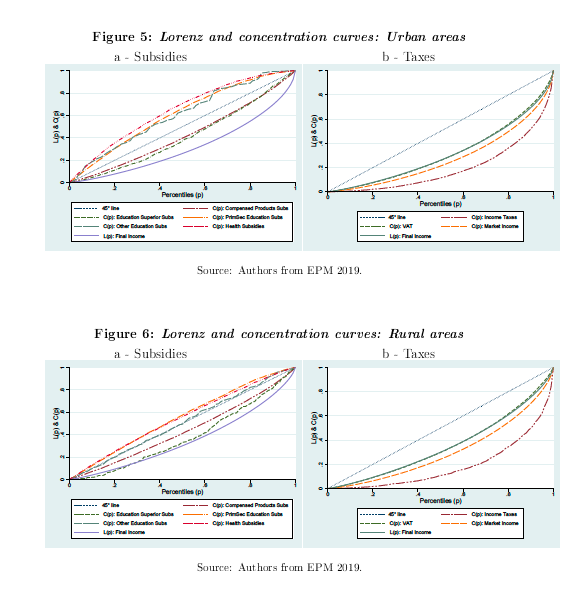
Lorenz and concentration curves for all considered components con rm the previous analysis. Subsidies tend to reduce inequalities, while IT and VAT increase them (Figures 3 a- and b-). Thus, subsidies for higher education and subsidized goods appear regressive, unlike subsidies for health or primary and secondary education. Similar results are obtained for urban and rural areas (Figures 5 and 6).
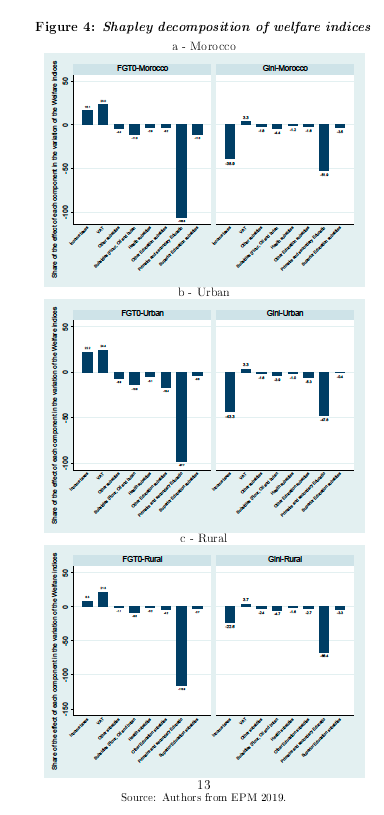
Finally, we measured the contribution of each tax and subsidy when moving from Market income to Observed income, applying the Shapley decomposition method introduced earlier.6 Overall, this method corroborates the results obtained previously. Taxes increase poverty, while subsidies as a whole reduce its incidence in Morocco. In terms of taxes, VAT increases both poverty (23%) and inequality (3.3%). So, this indirect tax is regressive in Morocco. As a result, any reform of the tax system should be undertaken with caution, so the situation of Moroccans is not worsened. As Alavuotunki et al. (2019) pointed out, the alternative is to have a progressive income tax. This is also the case in Morocco. We obtain a positive contribution to the variation in poverty (+16.1% for FGT0) and a negative contribution to inequality (−38.9% for the Gini index).
Regarding subsidies, our analysis shows that those for primary and secondary education contribute to both poverty reduction (−97.7%) and inequality reduction (−47.8%) in Morocco. We con rm the nding previously made concerning higher education subsidies, namely that although they help reduce the incidence of poverty, their contribution to inequality remains marginal (−0.4%). This result is observed in all areas, although the contribution is greater in rural than in urban areas. This leads us to conclude that the government's e orts on programs targeting primary and secondary education, as well as other programs (such as Tayssir ), should be maintained or even reinforced by other programs, given their greater impact on well-being. Subsidies on our, sugar, and gas also contribute to reducing poverty in Morocco (−13.8%). However, we note that the contribution to reducing inequality is only −3.9%. Furthermore, our results show that individuals living in urban areas bene t more from these subsidies in terms of their contribution to poverty reduction than those living in rural areas. This result shows that compensation does help poor households, but also bene ts clearly the less poor. The abolition of the compensation fund, as currently being discussed by the government, needs to be assessed in terms of its impact on poverty and inequality, taking into account not only the changes in behaviour that this would imply, but also the impact on the prices of other goods and therefore on expenditure.
Finally, although the health subsidy is progressive, its e ects are relatively weak. The contribution to poverty reduction is equal to 5.9%, while that to inequality reduction is only 1.0% in Morocco. We also note that this subsidy contributes very little to reducing poverty and inequality in rural areas.
4 Conclusion
We proposed a detailed diagnosis of the tax and subsidy system in Morocco for 2019. This allows to identify and specify whether subsidies and the main taxes are progressive or regressive. Using Shapley's decomposition method, we measure the contribution of each component of the Moroccan scal system to the passage from counterfactual Market income to Observed income, the income of individuals without taxes or subsidies.
We show that Morocco's tax/subsidy system is unambiguously pro-poor overall. Between a Market income and the Observed income, poverty decreases at the national level as well as in both rural and urban areas, as does inequality. Furthermore, income taxes appear to be progressive whereas the value added tax is clearly regressive, increasing poverty and inequality. Explicit subsidies on some products ( our, butane gas, and sugar) reduce poverty, although they are not pro-poor in the sense of Kakwani et al. (2000). In the current debate surrounding the abolition of the Caisse de compensation in Morocco, it would be important to deepen this work by carrying out an impact analysis to better understand the consequences of an eventual abolition, looking at both the direct e ects and the induced e ects on poverty and inequality. This analysis should also propose compensatory measures for poor and vulnerable households that would be a ected by its suppression.
However, the implicit subsidies relating to education (primary and secondary) are clearly propoor. The results obtained from the Shapley decomposition method show that the subsidies dedicated to primary and secondary education contribute strongly to the reduction of poverty and inequality, while the subsidy for higher education does not. This policy brief sets out the diagnosis required to continue work on social protection and tax reform in Morocco. Impact analyses should help decision-makers involved in the reforms make the Moroccan tax and subsidy system fully progressive across all its components.
References
Abdelkhalek, T. and Boccanfuso, D. (2023). Is the Moroccan scal system progressive ? A Shapely decomposition. In 2023s-22, Working Papers, CIRANO.
Abdelkhalek, T. and Ejjanoui, F. (2018). Impact des politiques scales sur la pauvreté et les inégalités au Maroc1. In Economic Research Forum (ERF) 24st Annual Conference March.
Alavuotunki, K., Haapanen, M., and Pirttilä, J. (2019). The e ects of the value-added tax on revenue and inequality. The Journal of development studies, 55(4):490 508.
Azevedo, J. P., Nguyen, M. C., and Sanfelice, V. (2012). Adecomp: Stata module to estimate Shapley decomposition by components of a welfare measure.
Ehrhart, H., Ihnach, H., El Ansary, A., Hamadi, A., Bakrim, H., Younger, S. D., et al. (2020).
Les effets de la politique budgétaire sur la pauvreté et les inégalités au Maroc. Technical report.
Foster, J., Greer, J., and Thorbecke, E. (1984). A class of decomposable poverty measures.
Econometrica: journal of the econometric society, pages 761 766.
Kakwani, N., Pernia, E. M., et al. (2000). What is pro-poor growth? Asian development review, 18(1):1 16.
Kakwani, N. C. (1977). Measurement of tax progressivity: an international comparison. The
Economic Journal, 87(345):71 80.
Lustig, N. and Higgins, S. (2012). Fiscal incidence, scal mobility and the poor: A new approach.
Technical report, Tulane University, Department of Economics.
Ravallion, M. and Chen, S. (2003). Measuring pro-poor growth. Economics letters, 78(1):93 99.
Sastre, M. and Trannoy, A. (2002). Shapley inequality decomposition by factor components:
Some methodological issues. Journal of Economics, 77(1):51 89.
Shapley, L. S. (1953). Stochastic games. Proceedings of the national academy of sciences, 39(10):1095 1100.
Shorrocks, A. F. et al. (2013). Decomposition procedures for distributional analysis: a uniffed framework based on the Shapley value. Journal of Economic Inequality, 11(1):99 126.
Figure 4: Shapley decomposition of welfare indices
5 Appendices
______________________________________________________________________________________________________________________________
1 Université Mohammed VI Polytechnique - AIRESS - FGSES - Morocco
2 The main taxes in force in Morocco are set out in the Code général des impôts (CGI). See the Code général des impôts and the Loi sur la scalité locale.
3 Information avalaible online : https://commitmentoequity.org
4 For a brief literature review, see for example Sastre and Trannoy (2002) and Shorrocks et al. (2013).
5 We thank ONDH for giving us access to the required modules to carry out our work.
6 We only present results for the incidence of poverty (FGT0) and for the Gini index. Decompositions of the other indices are available from the authors on request.