Publications /
Policy Brief
The energy landscape in 2024 is at a crossroads. Fossil fuels continue to dominate, with prices that are volatile due to geopolitical tensions and shifting demand patterns. However, renewable energy is on the rise thanks to cost declines, policy support, and growing consumer adoption. This Policy Brief examines five significant trends that will shape the energy landscape in 2024. Navigating the complex energy landscape requires careful risk monitoring and prudent policy responses. Key areas to monitor are potential spikes in oil and natural gas prices, and challenges to the expansion of renewable energy. By understanding these trends and proactively managing risks, countries can ensure a more sustainable and secure energy future.
Introduction
The global energy landscape is at a critical juncture, marked by the continued dominance of fossil fuels and the burgeoning potential of renewable energy sources. In 2024, major changes in energy production, consumption, and policy are likely to be seen, with profound implications for economic and environmental sustainability.
Fossil fuels, which shaped the twentieth century, retain their formidable market share. Geopolitical uncertainties in the Middle East, and China’s high demand for energy, are likely to keep oil prices volatile and high. Although coal consumption may have peaked, its impact still persists in Asia due to strong industrial activity. Natural gas is susceptible to supply fluctuations and geopolitical tensions, which could lead to price increases and supply disruptions in vulnerable regions like Europe.
Against this backdrop, renewable energy sources are becoming an increasingly powerful counterpoint. Solar power is expanding vigorously, driven by factors including falling costs, favorable government policies, and rapid consumer adoption. Although wind power may face temporary headwinds from political obstacles, its long-term prospects remain undeniably promising. Battery technologies are crucial for the green revolution and are steadily improving in terms of efficiency and capacity. They have the potential to reduce dependence on fossil fuels.
However, there are still major challenges to overcome. Supply chains for essential minerals, which are vital components for renewable technologies, remain fragile and vulnerable to disruption and environmental concerns. Moreover, progress towards a sustainable future can be impeded by political will, which is often influenced by short-term pressures and vested interests. It is important to note that the foreseen transition to a sustainable energy future varies according to the economic priorities of each country, which is entirely legitimate.
This Policy Brief explores the key energy trends experienced in 2023 and potential scenarios for 2024. While providing a global perspective, the analysis recognizes the need to take into account regional variations that may deviate significantly from overarching trends.
Trend 1: Fossil Fuel Price Volatility Is Expected to Persist Throughout 2024
After turbulent years characterized by COVID-19 disruptions, uneven post-pandemic recoveries, sluggish economic growth, and geopolitical tensions in Eastern Europe, 2023 initially emerged as a period of relative rebalancing for fossil-fuel markets. This period of relative reprieve was, however, disrupted in the closing months of 2023 by the outbreak of conflict in the Middle East, which had a noticeable impact on the prices of certain fuels in the short term.
Brent crude oil prices initially registered an 8% decline in the first quarter of 2023 (2023Q1) compared to 2022Q4, followed by a further 4% decrease in 2023Q2. Prices have, indeed, exhibited significant volatility since March 2023, primarily driven by two key factors: fluctuating economic growth expectations amidst tightening monetary policy in advanced economies, and OPEC+ oil production adjustments. This volatility materialized in a discernible downward trend with April 2023 witnessing a marked price dip, while relative stability prevailed in May and June (Figure 1). These fluctuations coincided with renewed concerns about a global recession, fueled by the struggles of major banks (World Bank Group, 2023).
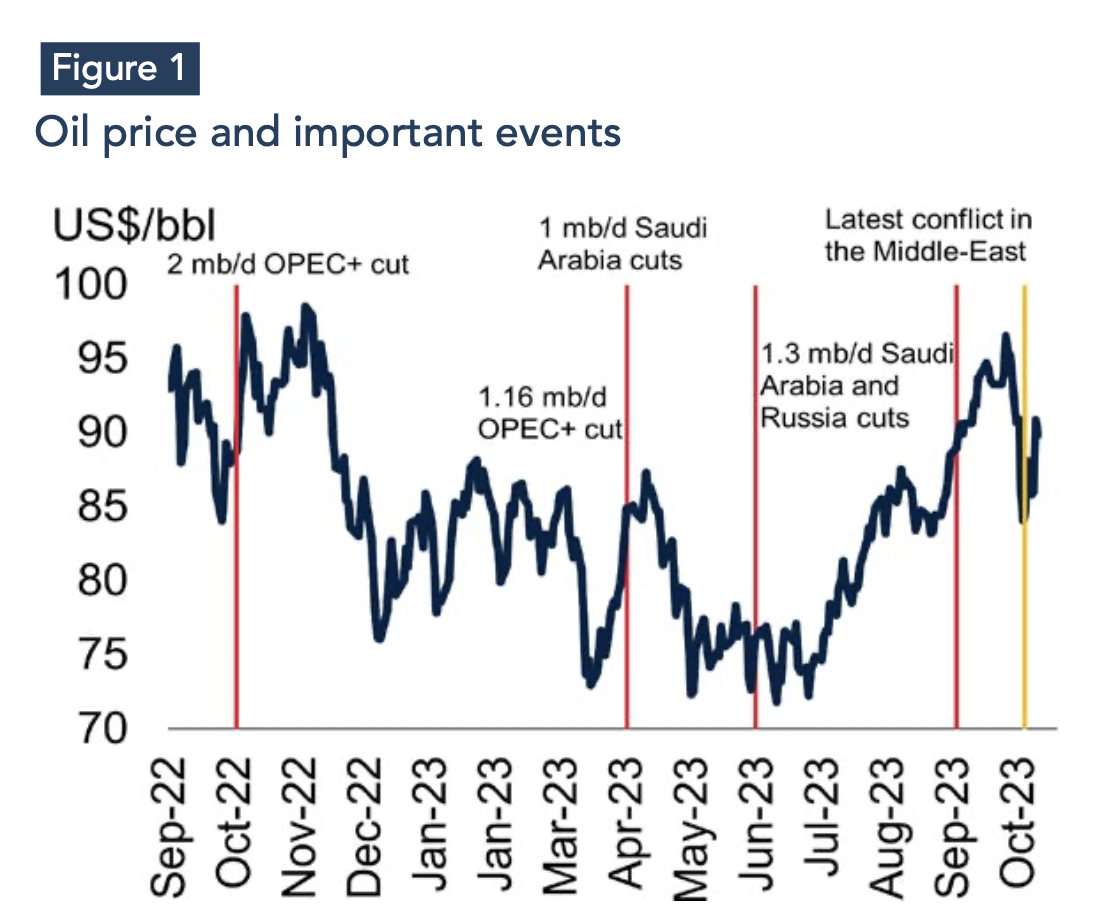
Sources: Bloomberg; World Bank. Note: Daily Brent prices and important events. Red lines show two mb/d cuts by OPEC+, 1.16 mb/d cuts by OPEC+; 1 mb/d cut (Saudi Arabia) and extension of previous cuts to the end of 2024, and 1.3 mb/d cut extension (Saudi Arabia and Russia). The yellow line shows the start of the conflict in the last Middle East. The last observation is October 16, 2023.
However, a notable reversal emerged in 2023Q3, with Brent crude oil prices surging by 11% relative to 2023Q2. This pronounced shift was primarily attributable to a series of announcements and voluntary oil production cuts implemented by OPEC+. Notably, in June, OPEC+ extended all existing voluntary cuts, originally set to expire in December 2023, to December 2024 (World Bank Group, 2023). Additionally, Saudi Arabia committed to an additional cut of 1 million barrels per day (mb/d) starting in July (Ministry of Energy of Saudi Arabia, 2023). This concerted effort by OPEC+ contributed to a dramatic Brent price increase of nearly $25/bbl between mid-June and end-September.
Since October 2023, prices have surged by 6%, largely owing to uncertainties surrounding potential supply disruptions arising from the ongoing conflict in the Middle East. Consequently, it is anticipated that crude oil prices will continue to exhibit volatility in the foreseeable future. Despite the recent price increases, the average price of Brent crude for 2023 was $81 per barrel, down from its near-$100 per barrel peak in 2022 (Figure 2). While price forecasts anticipate a slight decrease in 2024, prices are still expected to hover approximately 16% above their five-year average of $70/bbl (World Bank Group, 2023).
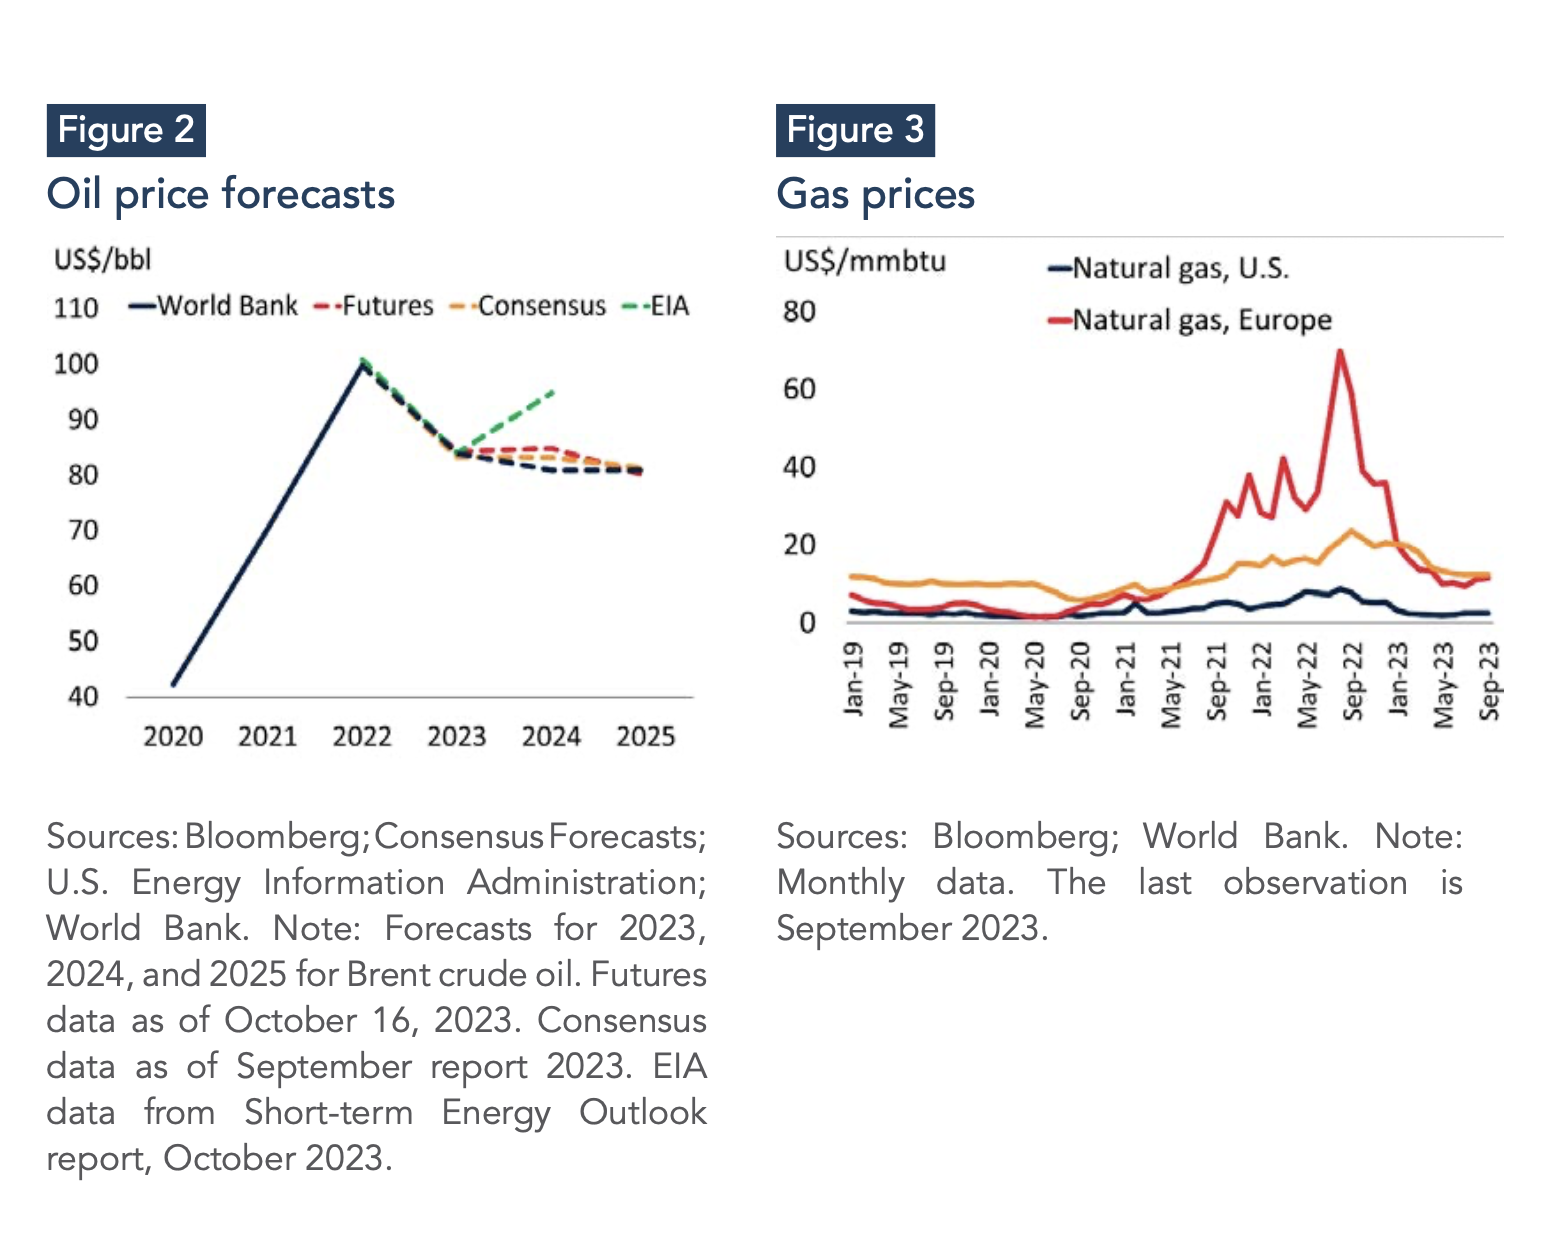
Echoing the volatility observed in oil markets, natural gas prices also entered a period of heightened instability towards the end of 2023, primarily driven by the ongoing conflict in the Middle East. This followed a period of significant decreases in European gas prices, initially with a 54% drop in 2023Q1 compared to 2022Q4, followed by further declines of 33% and 5% in subsequent quarters (Figure 3). This downward trend reflected market rebalancing after the disruption caused by Russia's reduced gas exports due to the Russo-Ukrainian War. Notably, seasonal inventory levels within the European Union reached significantly higher levels compared to historical averages because of increased imports and reduced demand. This resulted in the EU achieving its 90% storage-fill target by August 2023, well ahead of the onset of winter demand (World Bank Group, 2023, S&P Global, 2023). The U.S. benchmark (Henry Hub) also exhibited pronounced volatility throughout 2023, with a 20% price surge in 2023Q3 after significant declines in both 2023Q1 (51%) and 2023Q2 (18%). Japanese LNG prices, meanwhile, experienced a steady decline throughout the first three quarters.
October 2023 saw a notable reversal, with European gas prices surging by 35%. This sudden spike can be attributed to a confluence of factors: the shutdown of a major gas field off the Israeli coast, an explosion at a critical interconnector in the Baltic Sea, and escalating concerns about the potential intensification of the conflict in the Middle East (World Bank Group, 2023).
Despite the recent price jump in Europe, overall natural gas prices were significantly lower in 2023 than in 2022, reflecting the gradual market rebalancing from earlier disruptions in 2022 and 2021 Specifically, European gas prices declined by 68% in 2023, followed by a further 4% forecast decrease in 2024. The U.S. benchmark price is expected to follow a similar trend, with a decline of 58% in 2023 and a subsequent projected 20% increase in 2024. This projected rise for the U.S. benchmark aligns with anticipated global LNG price movements, with Japan's LNG price likely mirroring the European trend (World Bank Group, 2023).
Meanwhile, coal prices, following a pronounced decline in 2022, continued their downward trajectory in the third quarter of 2023, driven by a confluence of factors (Figure 4). Australian coal prices, a bellwether for the global market, fell by 8% in 2023Q3, further extending the 31% drop observed in the preceding quarter. South African coal prices followed a similar downward trend. By mid-October 2023, Australian coal prices had plunged to roughly one-third of their peak level recorded shortly after the Russian invasion of Ukraine.
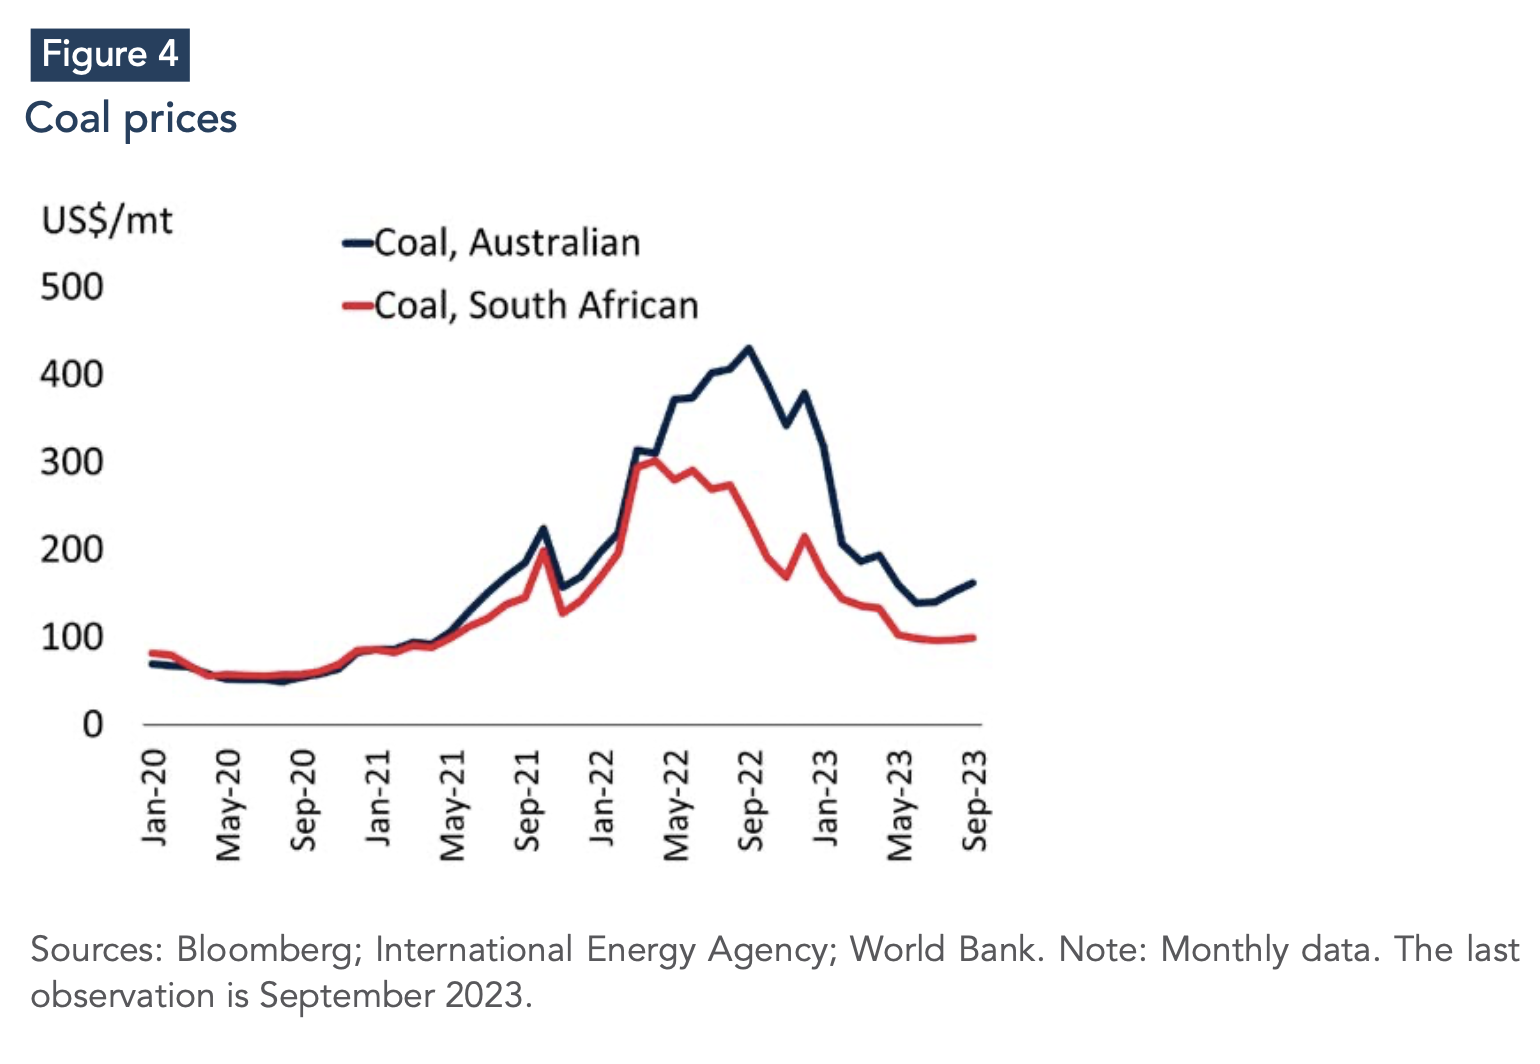
This sustained price decline can be attributed to several factors. Most prominent among these is fuel substitution, propelled by falling natural-gas prices, elevated EU emissions trading system (ETS) allowance prices, and ample coal stockpiles, particularly in Europe. Additionally, increased supply from major producers and higher export volumes from Indonesia contributed to lowering market prices.
Looking ahead, coal prices are projected to experience further declines, albeit at a reduced rate. It is estimated to decline by a 49% in 2023, followed by a 26% decrease in 2024. However, it is noteworthy that even after these projected adjustments, coal prices are expected to remain significantly above the average observed between 2015 and 2019 (World Bank Group, 2023).
Trend 2: Fossil Fuel Consumption Will Continue to Be Driven by Developing Countries
The demand for fossil fuels has evolved differently in developed and developing regions, masking significant disparities when looking at average trends (Figure 5). From January to September 2023, emerging markets and developing economies saw a combined increase of 2.3 mb/d in oil demand. China was the main driver of this growth, with a 12% increase in oil consumption compared to the same period in 2022. Notably, despite China's subdued GDP growth in 2023Q2, and ongoing strains within its real-estate sector, its resilience defied expectations. A multitude of factors, including a persistently recovering transportation sector, contributed to this robust Chinese demand. India mirrored this upward trend, registering a 4% increase in oil consumption during the same timeframe.
Conversely, advanced economies maintained stable oil demand throughout the first nine months of 2023, as declines in Europe were offset by increases elsewhere. The 0.5% decline in European oil demand reflected weaknesses in the industrial sector and anticipation of sustained high interest rates. In contrast, the United States showed strong demand for jet fuel, kerosene, LPG, and ethane. This was due to a resilient labor market and surprisingly strong economic activity, which proved more resistant to higher interest rates than initially anticipated (World Bank Group, 2023).
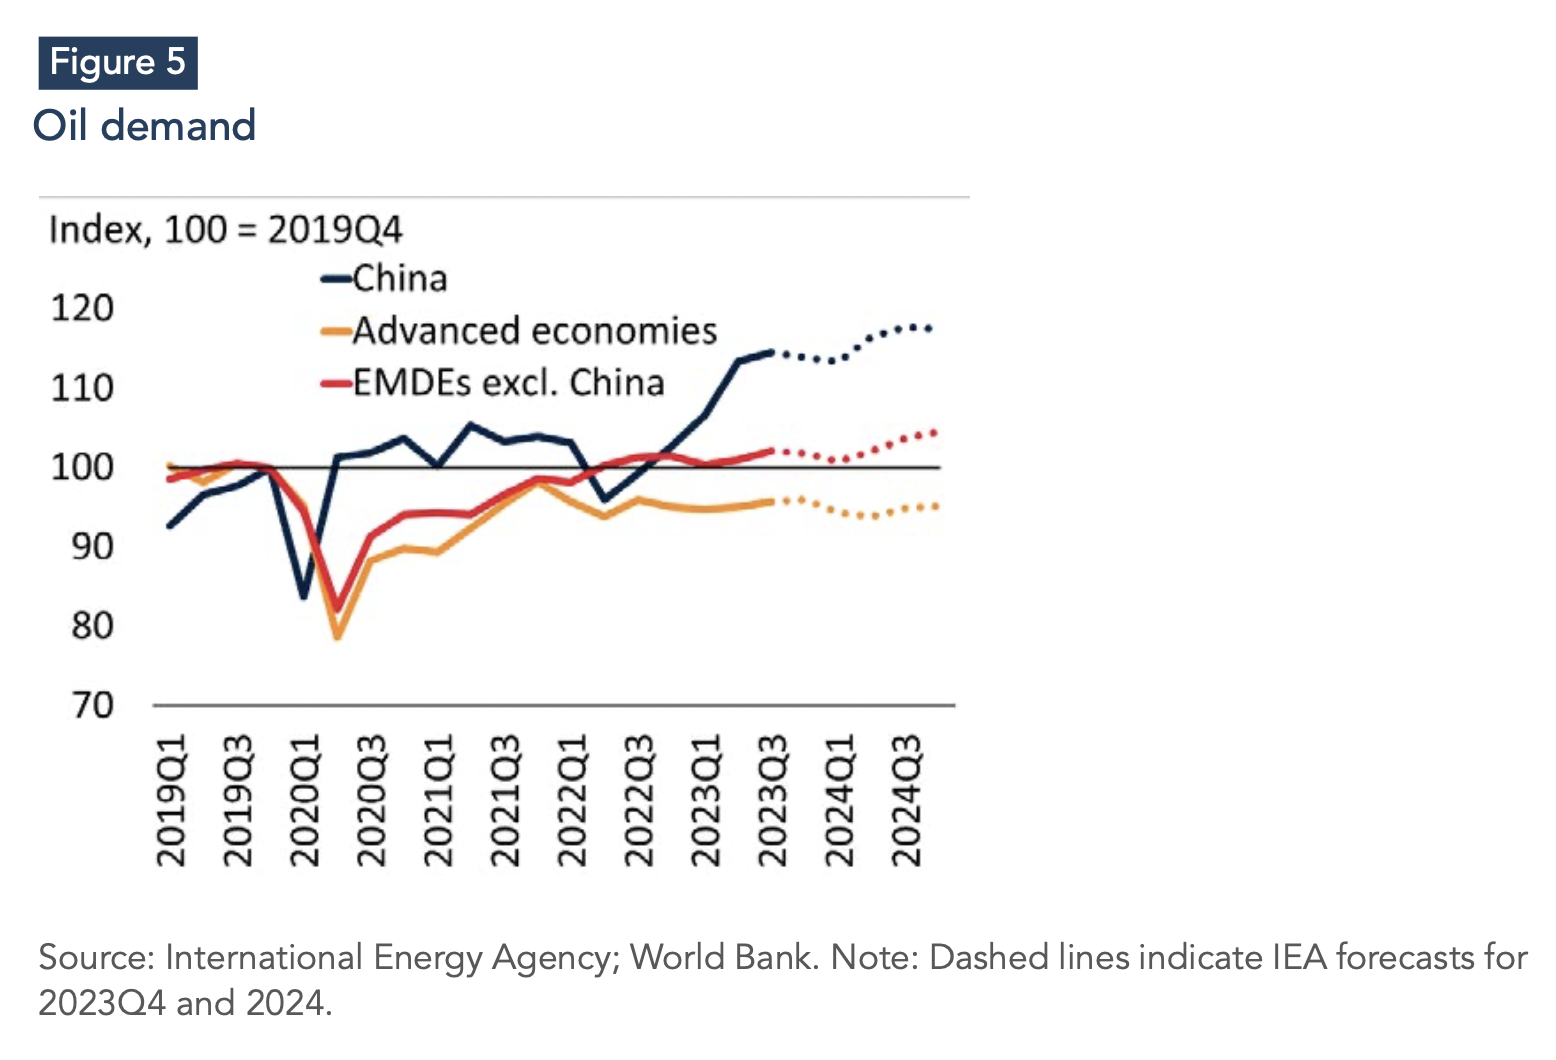
Predictions for future oil demand vary greatly. The World Bank predicted a 2% increase in oil consumption for 2023, resulting in a record high of 101.9 mb/d. However, demand growth is expected to slow to 1% in 2024 due to the delayed impact of tighter monetary policy in advanced economies (World Bank Group, 2023, IEA, 2023). Chinese demand is projected to increase by only 0.6 mb/d in 2024 due to expected economic moderation. The majority of the remaining global oil demand growth in 2024 is expected to come from other Asian countries. Additionally, the International Energy Agency (IEA) forecasts a decline in oil demand in advanced economies in 2024, following stable demand in 2023 (IEA, 2023a).
Alternatively, the Economist Intelligence Unit (EIU) paints a more optimistic picture, forecasting a 1.7% year-on-year expansion in oil demand for 2024, primarily driven by Asia, Latin America, and the Middle East, where demand continues to grow rapidly despite high oil prices. Developed economies are expected to exhibit slow demand growth, with North America expanding by only 1.1% and Europe remaining stagnant (EIU, 2023a).
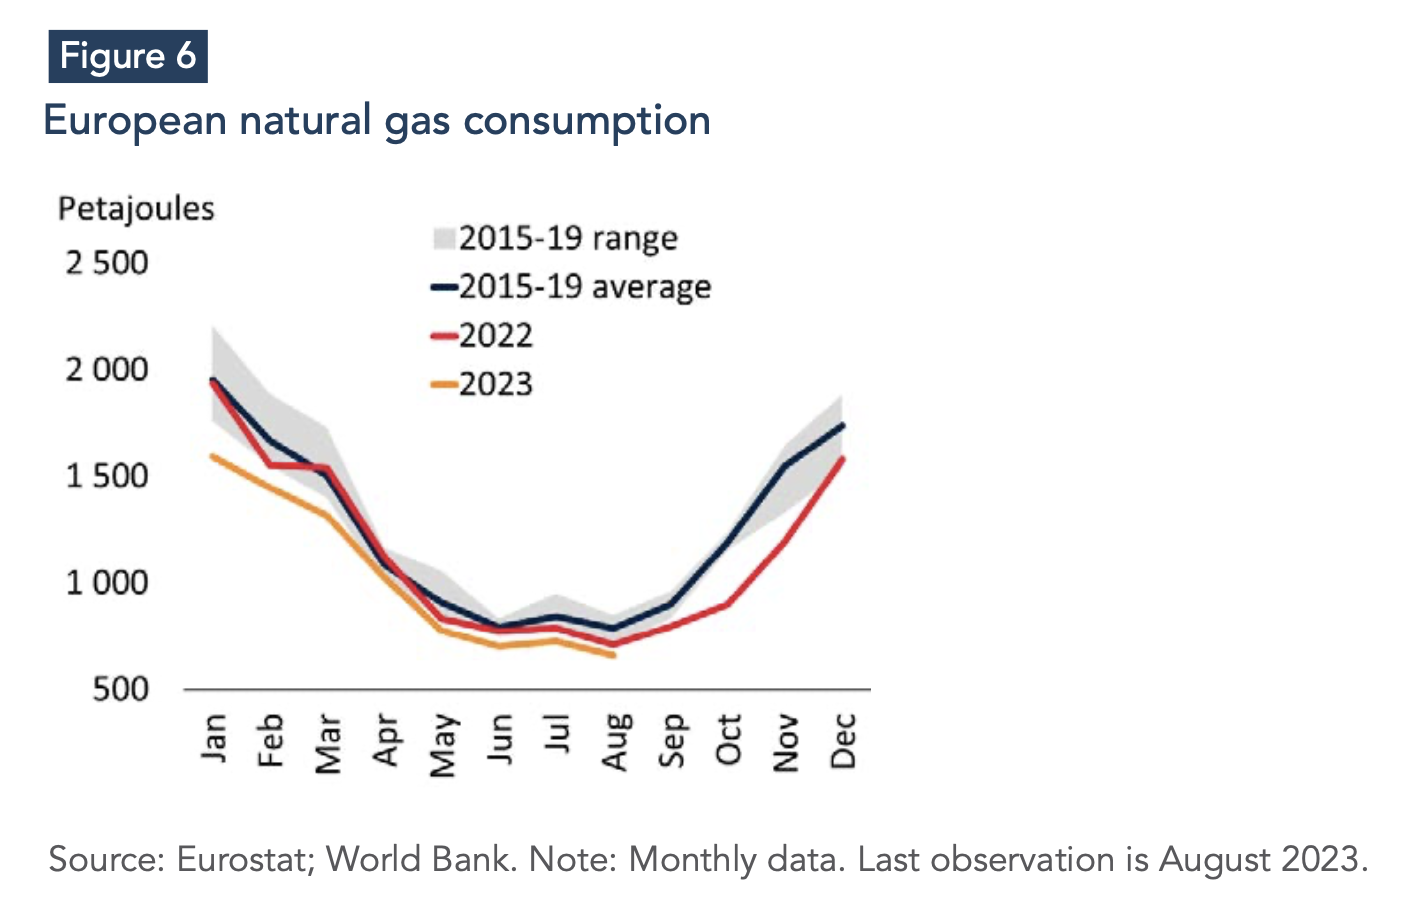
The demand for natural gas follows a similar trajectory to that of oil, exhibiting notable divergence between developed and developing regions. In OECD Europe, lower gas prices in 2023Q3 led to a partial increase in industrial consumption, while other sectors’ consumption remained sluggish. As a result, overall demand in the region decreased by 9% in the first nine months of 2023 (Figure 6). The decrease in gas demand was mainly due to reduced consumption in the power sector, fuel switching, efficiency enhancements, and the impact of the European Gas Demand Reduction Plan.
On the other hand, the Asia Pacific region experienced a 2.5% increase in gas demand during the first eight months of 2023, driven by strong growth in both China’s industrial and power sectors. India’s gas consumption also significantly rebounded in response to more favorable prices. During the first nine months of 2023, gas consumption in North America increased by only 1%, mainly due to the power sector.
World Bank projections predict that global natural gas demand increase by a modest 1.6% in 2024, after remaining mostly unchanged in 2023 compared to 2022. This growth is expected primarily in regions such as Asia, the Middle East, and North Africa. This forecast aligns with the Economist Intelligence Unit’s (EIU) outlook, which suggests that European gas demand throughout 2023-2024 is unlikely to return to the levels seen prior to Russia’s war in Ukraine. On the other hand, gas consumption in Asia and the Middle East is expected to grow quickly, mainly due to strong demand from the power generation industry (World Bank Group, 2023, EIU, 2023a).
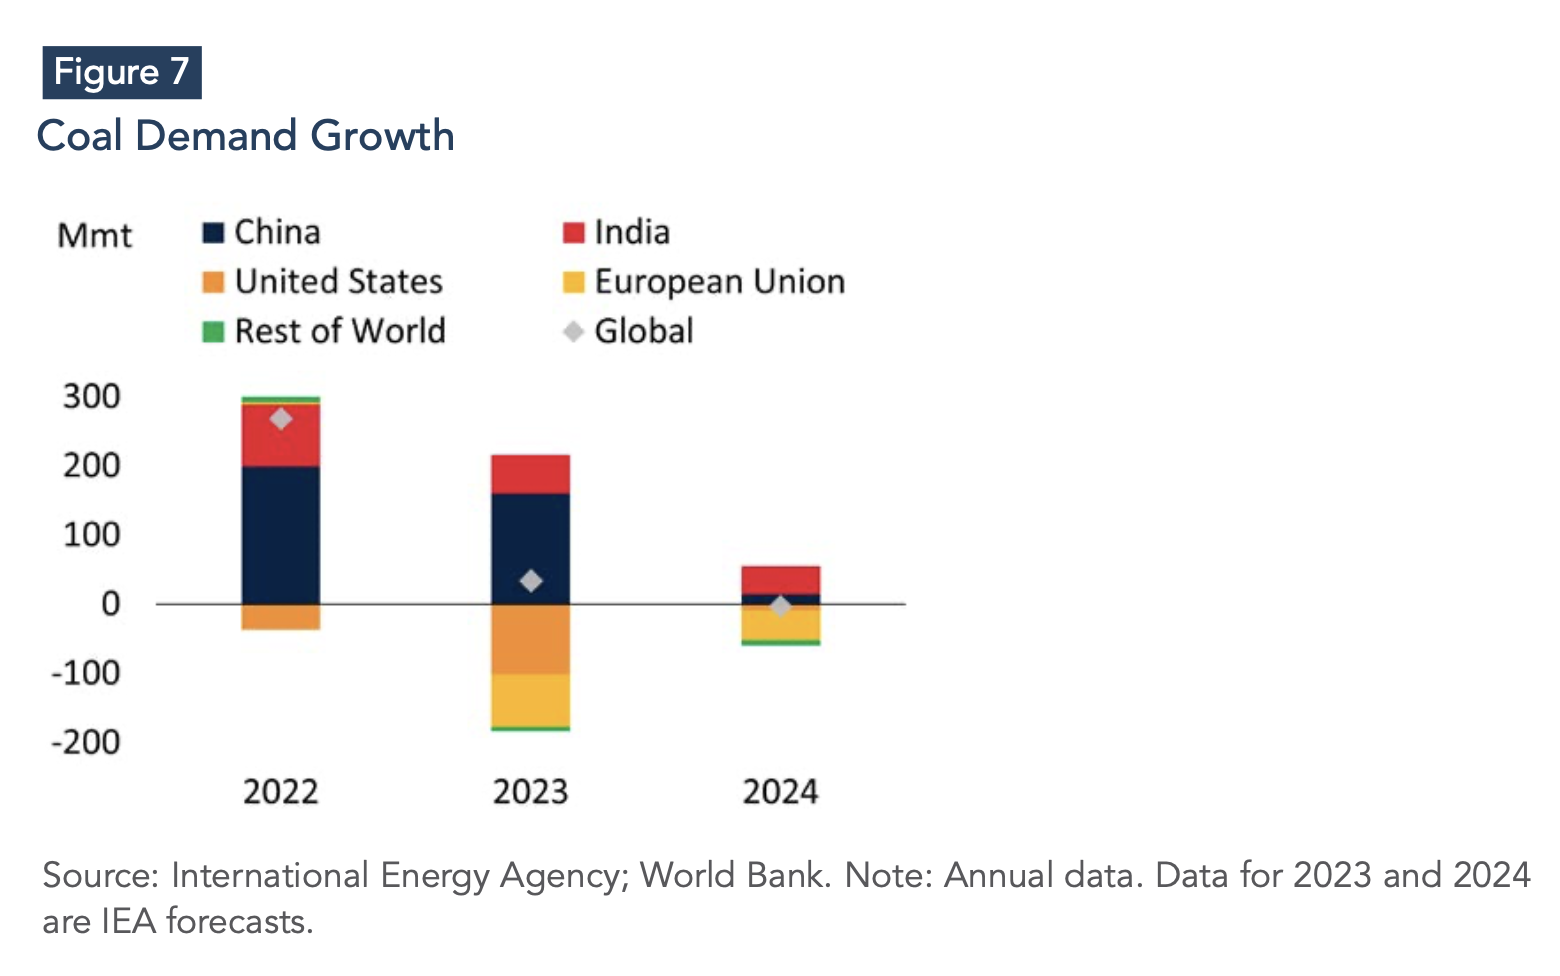
After a period of record-high growth in 2022, global coal consumption slowed in the first half of 2023, with only a 1.5% increase (Figure 7). Recent estimates suggest that coal consumption continued to slow throughout 2023. The deceleration in demand can be attributed to various factors. In India, reduced electricity demand and increased hydropower output led to a decrease in coal consumption. Similarly, China's consumption growth slowed due to a decrease in energy demand. The United States experienced a significant 24% decline in coal consumption during the first half of 2023, primarily due to mild weather conditions and strong growth in renewable energy output. Conversely, Indonesia’s coal consumption increased by 30% in 2022 due to strong economic growth, rising power demand, and industrial expansion.
Reflecting these trends, the World Bank anticipates a moderation in global coal consumption, with less significant increases in China and India and more pronounced declines in the United States and the European Union. As a result, global coal consumption is expected to plateau in 2024. This change in consumption patterns also emphasizes a continued shift towards Asia, with China and India representing about 70% of global coal consumption by the end of 2023 (IEA 2023a).
Contrary to the World Bank’s forecast, the EIU predicts that global coal demand will continue to grow until 2026, with a simultaneous peak occurring both globally and in China during that year. This projection is based on the expectation that governments will prioritize energy security concerns. However, the EIU anticipates that the surge in European coal demand observed in 2022, triggered by the sudden decline in gas supplies, will be short-lived. European coal consumption is expected to sharply decline in 2024 as France and the UK phase out coal-fired power generation (EIU, 2023a).
Trend 3: Oil and Gas Production Is Set to Grow, But at a Moderate Level
Global oil production increased moderately throughout 2023. Notably, Russian production remained unchanged, while Iranian output climbed to its highest level since 2019Q1. The United States saw a moderate production increase of 1.4 mb/d in the first nine months of 2023 compared to the previous year. However, rising production costs have begun to manifest in the form of capacity constraints. Modest output gains are anticipated in Brazil (0.3 mb/d) and Guyana, Mexico, and Norway (0.1 mb/d each).
The World Bank’s projected oil production outlook hinges on the assumption of no escalation in the Middle East conflict. It further anticipates a global production increase of 1.5% in 2024, mirroring the growth observed in 2023. This expansion is expected to be driven by both OPEC+ and non-OPEC+ members. Within non-OPEC+ countries, U.S. production growth is anticipated to decelerate to 0.5 mb/d, with smaller contributions from Brazil, Canada, and Guyana, adding collectively roughly 0.7 mb/d (EIA 2023a). Conversely, OPEC+ output is projected to climb modestly in 2024.
However, a contrasting trend is anticipated for Russia, with production declining by up to 0.3 mb/d by the end of 2023 and remaining stagnant in 2024 (EIA 2023a; IEA 2023a). Supply from other OPEC+ members is projected to remain close to current levels in 2024, mirroring the group’s 2023 guidance, but falling slightly short of 2022 figures. Consequently, global oil supply is expected to exceed demand in the first half of 2024, before aligning with it in the remaining half, leading to an overall inventory increase (World Bank Group, 2023).
Diverging from this outlook, the Economist Intelligence Unit (EIU) projects a more robust supply response in 2024, primarily driven by non-OECD economies. Their forecast anticipates additional production of roughly 1.2 mb/d from producers throughout the year, in response to continued high prices and sustained demand growth in developing countries (EIU, 2023a).
In the natural gas market, lower production in Russia is being offset by increases in most other regions, particularly the United States. During the first three quarters of 2023, the increase in U.S. supply varied across individual shale gas plays, but overall production grew by 5% year-on-year. Notably, Q2 2023 delivered the highest quarterly production on record (EIA 2023b). Russian output is estimated to have declined by 8% in 2023, following a 12% drop in 2022, as increased exports to China and Central Asia were unable to compensate fully for the fall in pipeline exports to European countries. Conversely, production increased in China during the first half of 2023 as part of the government’s strategy to enhance energy security. Similarly, the Middle East saw production growth, reflecting long-term efforts to expand the region’s share of the global LNG market.
Following a slight decline in 2023, global natural gas production is anticipated to increase by 1.6% in 2024. However, this projected growth falls slightly short of anticipated increases in demand, indicating a tight market throughout the forecast period. In 2024, output is projected to increase by approximately 2.5% in the Middle East and 3% in Russia. While United States output growth is expected to slow, it is forecast to remain positive.
Trend 4: Renewable Energy Capacity Additions is Set to Increase, With China Being a Main Driver
In 2023, global renewable energy capacity increased by 107 GW, surpassing 440 GW. This exceeds the current combined installed power capacity of Germany and Spain (IEA, 2023b). This robust expansion is being driven by a confluence of compelling factors. First, expanding policy support in various regions, particularly in response to heightened energy-security concerns, is playing a key role in driving deployment. Second, the increasing competitiveness of renewable energy sources relative to fossil fuels is making them a more attractive alternative, further driving their adoption. Notably, these factors are proving resilient to challenges such as rising interest rates, escalating investment costs, and ongoing supply-chain disruptions.
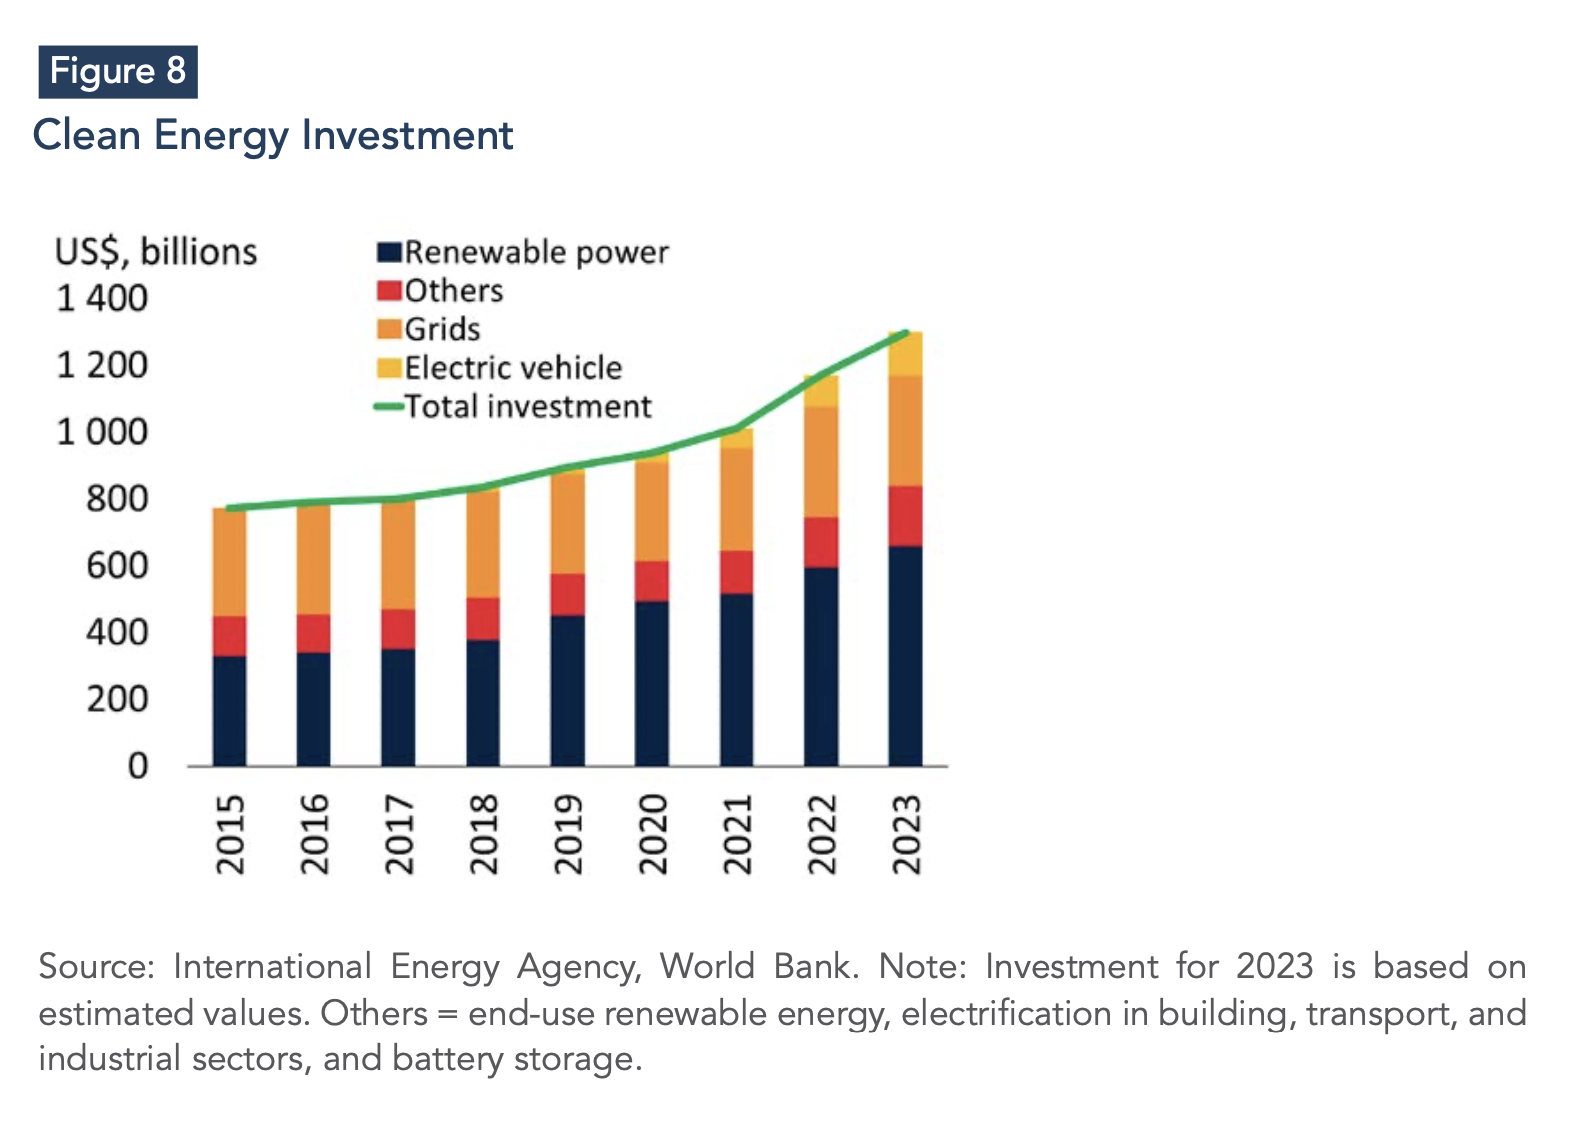
This continued momentum is further reinforced by the observed increase in clean-energy investment (Figure 8). Compared to 2022, total clean-energy investment increased by 11% in 2023, driven primarily by investments in renewable power generation, which accounted for the largest share of clean-energy investment (51%), followed by grids (25%), and electric vehicles (10%).
Growth in renewable energy capacity in 2023 was driven by solar PV, which accounted for two-thirds of this expansion, mainly in distributed residential and commercial installations, driven by rising energy prices and rapid deployment potential. It is worth noting that these distributed PV systems are expected to exceed onshore wind installations in 2024 (IEA, 2023b). On the other hand, onshore wind is recovering after two years of decline, driven by the commissioning of delayed projects in China and faster expansion in Europe and the U.S. However, the growth of offshore wind is lagging because of limited project pipelines outside of China.
In 2024, the renewable energy landscape presents a contrasting picture. Solar PV is basking in the glow of continued expansion, while wind energy faces blustery challenges. The photovoltaic revolution is driven by a trifecta of favorable factors: declining module prices, surging adoption of distributed systems, and supportive policies across major markets. This potent cocktail fuels solar additions in China, the European Union, the United States, and India. Conversely, the absence of prompt policy interventions poses a threat to onshore wind (EUI, 2023a). Global additions are expected to decrease by 5% in 2024, as China's sustained growth fails to make up for Europe's halted auctions and permit delays. Nevertheless, new legislation offers the potential to alter the course of wind power (IEA, 2023b).
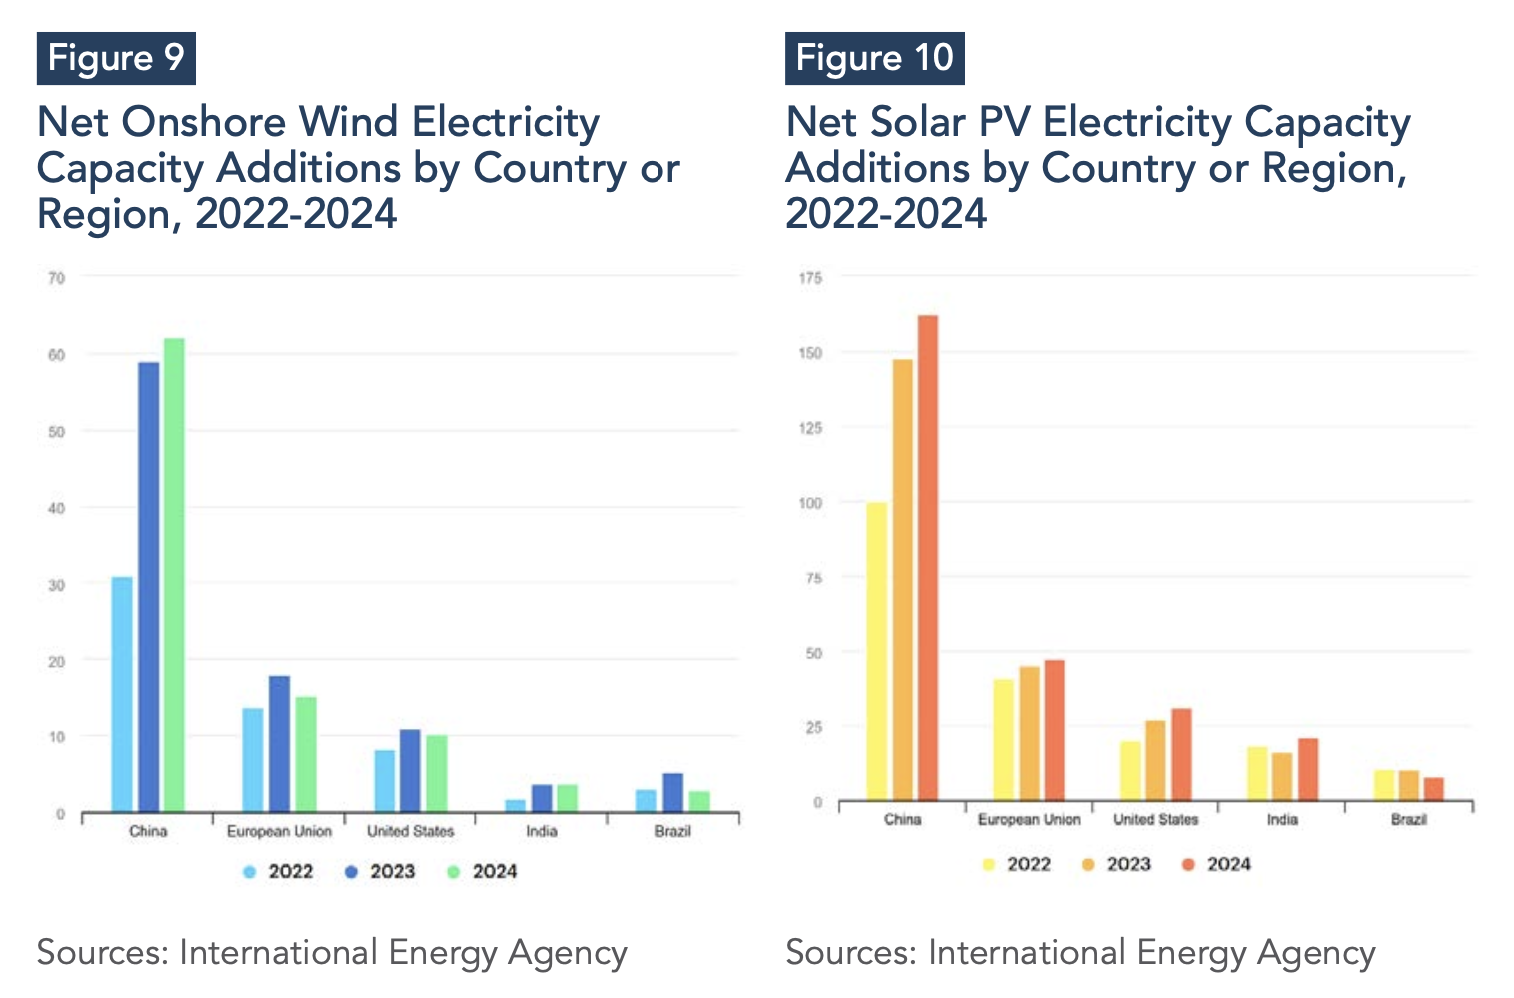
Despite these differences, the future looks promising for renewable energy. Global capacity is expected to exceed 4,500 GW by the end of 2024, which is equivalent to the combined capacity of China and the United States (IEA, 2023b). A notable trend for 2023 and 2024 is the expected rise of China in global renewable capacity additions, further cementing its position as the world’s leading country in renewable energy deployment (Figures 9 and 10). In 2022, China contributed almost half of the new renewable power capacity installed worldwide. By 2024, this share is expected to increase to a record 55%, representing a significant portion of the annual global renewable capacity deployment. Additionally, China is set to lead in specific renewable sectors, with an estimated 70% of all new offshore wind projects globally, over 60% of onshore wind, and 50% of solar PV projects by 2024 (IEA, 2023b). Overall, unlocking stalled projects, streamlining construction, and ensuring timely grid connections, are the keys to unlocking the potential of renewable energy. While wind energy is subject to policy changes, solar energy’s consistent growth paves the way for a greener future.
Trend 5: Demand For Critical Minerals Will Increase, Driven by Increased Use in The Green Energy Industry
The prices of critical minerals essential for clean-energy technologies have been affected by a range of factors: a sluggish global economy, heightened geopolitical tensions, and the urgency of the energy transition. In the third quarter of 2023, this interplay continued to exert downward pressure on prices (Figure 11), as lithium and cobalt, key components of battery technology, depreciated by 20% and 4%, respectively, compared to the previous quarter. Rare earths and molybdenum prices remained relatively stable, but showed underlying market tensions through occasional volatility. This downward trend reflects a broader phenomenon affecting the metals sector, driven primarily by a slowdown in global economic activity and, consequently, subdued demand (World Bank Group, 2023).
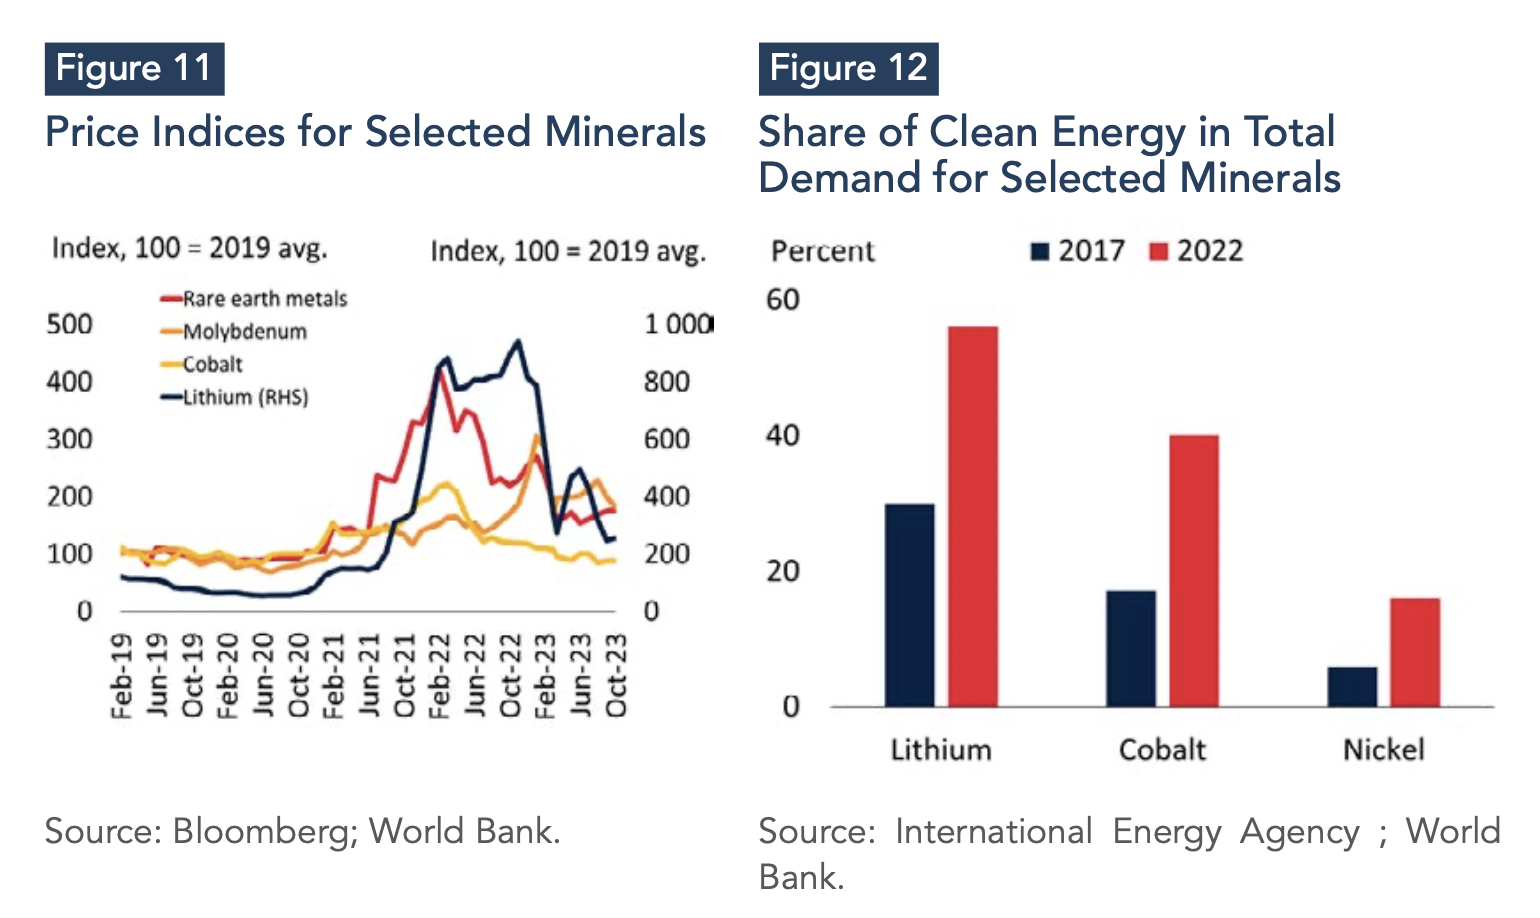
While the current decline in demand for critical minerals may raise concerns about their price, it is crucial to recognize this as a temporary phenomenon within a broader context of robust long-term structural demand growth. This optimistic outlook is reinforced by projections of a substantial increase in overall clean-energy investment, with a 24% increase expected between 2021 and 2023 (Agnolucci et al, forthcoming). Notably, despite the recent price falls, current critical mineral prices remain well above historical averages (IEA, 2023c). This sustained increase is primarily driven by burgeoning activity in sectors including battery storage, electric vehicles, and renewable power generation. As investment in these key sectors continues to grow, so will the demand for critical minerals, because of their indispensable role in renewable technologies.
Nevertheless, concerns remain about potential supply disruptions arising from the long timelines for bringing new mining projects online. For example, the timeframe from discovery to operational production for copper, lithium, and nickel ranges from four to 20 years, depending on a number of factors, including commodity type, regional regulations and deposit characteristics. Environmental, social, and governance (ESG) considerations are also becoming increasingly important, particularly given the location of many key mineral resources in environmentally and socially sensitive areas.
Looking ahead, demand for critical minerals is expected to rise steadily, following the consistent growth observed since 2017 (Figure 12). This upward trend will be driven by growing consumer and business appetite, particularly in the rapidly expanding electric vehicle market, which is expected to more than double between 2022 and 2027 (EIU, 2023b). This will prompt major economies to diversify their supply chains, with Australia and Canada emerging as potential powerhouses due to their significant resource endowments and recent commitments to exploration (40% annual increase in 2022 compared to 20% globally). Notably, emerging markets are also looking to move up the value chain and reduce their reliance on China for raw mineral exports, at times imposing bans on unprocessed exports to encourage domestic processing. Ultimately, successful diversification will depend on countries’ ability to leverage global markets, and attract long-term foreign investment in mining and processing infrastructure.
Conclusion: Risks to Monitor
While predicting what will happen in 2024 is a thankless exercise, the turbulent waters of the global energy landscape in 2024 present a complex tableau of interconnected risks and promising advances. This complicated environment demands close scrutiny, as navigating its myriad currents will ultimately determine the trajectory of the world’s energy future. It also requires continuous monitoring, as these trends are highly sensitive to a volatile environment. This Policy Brief identify three main areas to watch:
Oil Markets on a Tightrope
The global oil market is walking a precarious tightrope, balancing between potential spikes and dips. The looming shadow of the Middle East conflict looms large, with any escalation capable of triggering drastic price spikes, depending on the severity of supply disruptions. Three scenarios paint a vivid picture: a small disruption could push prices up by 3%-13%, mirroring past events such as the Libyan war; a medium disruption could push them 21%-35% above baseline projections; and a large disruption could send them soaring by 56%-75% (World Bank Group, 2023).
It's important to remember, however, that these are initial shocks, and the long-term impact depends heavily on the duration and scale of the conflict. Beyond the Middle East hotspot, other risks lurk. A sharper-than-expected slowdown in China could dampen demand and drag down prices. Conversely, further production cuts by OPEC+, or restrictions on Russian oil output, could fuel an upward price spiral. Finally, the trajectory of U.S. shale production adds another layer of uncertainty. If it falls short of projections, particularly in 2025, prices could rise because of supply constraints. Navigating these treacherous waters requires sound policy responses. Price controls and broad-based energy subsidies are tempting but ultimately self-defeating. Instead, policymakers should prioritize targeted support for vulnerable groups, and temporary assistance with real income effects.
Natural Gas: A Precarious Path Toward Price Hikes
The natural gas market in 2024 also treads a precarious path, with the odds stacked in favor of price increases. The specter of escalating conflict in the Middle East looms large, threatening cascading disruptions that could send gas prices soaring in Europe and Asia, which rely heavily on liquefied natural gas (World Bank Group, 2023). Other trade disruptions, whether from pipeline sabotage or labor disputes, pose another volatile threat. Weather patterns also play a role, with El Niño potentially leading to hot summers in the U.S. and cold winters in Europe, both of which would increase demand for gas and push prices even higher. On the other hand, a potentially deepening global economic slowdown, particularly in China, could dampen industrial activity and gas demand, offering a glimmer of hope for downward price pressure. Navigating this dynamic landscape requires close attention to be paid to evolving risks, and prudent policy responses to ensure market stability and mitigate the sting of potential price volatility.
Renewable Energy: Headwinds Amidst Progress
While offshore-wind auctions around the world aim to unlock renewable potential, they face headwinds from rising costs, supply-chain disruptions, and inadequate infrastructure, a scenario reflected in recent lackluster auctions. Another area of risk is the delay in the implementation of renewable energy strategies, which may, dampen the efforts made so far by some countries. For instance, Indonesia's delayed energy transition plan, a $20 billion collaboration with developed countries to peak power sector emissions by 2030 and achieve net zero by 2050, underscores the complexity of balancing fossil-fuel dependence with climate goals. Navigating these divergent trends will be critical in determining the trajectory of the world’s energy future.
References
Agnolucci, P., V. Mercer-Blackman, P. Nagle, and H. Zahid. Forthcoming. The Energy Transition: A Paradigm Shift for Commodity Markets. Policy Research Note, World Bank, Washington, DC.
EIU (Economist Intelligence Unit). 2023a. Energy Outlook 2024: Surging Demand Defies Wars and High Prices.
_2023b. Global Outlook: is critical mineral diversification possible? Available at: https://www.eiu.com/n/global-outlook-critical-mineral-diversification/#:~:text=EIU%20expects%20demand%20for%20critical,2027%2C%20will%20further%20fuel%20demand.
IEA (International Energy Agency). 2023a. Oil Monthly Report. September. International Energy Agency, Paris.
_ 2023b. Renewable Energy Market Update - June 2023. Executive Summary.
_ 2023c. Critical Minerals Market Review 2023. Flagship Report.
Ministry of Energy of Saudi Arabia. 2023. Ministry of Energy announces that Saudi Arabia will continue the voluntary cut of one million barrels per day in December 2023. Available at: https://www.moenergy.gov.sa/en/MediaCenter/News/Pages/Saudi-Arabia-extends-voluntary-cut-1-mbd-during-December-2023.aspx#:~:text=%E2%80%8BAn%20official%20source%20from,the%20end%20of%20December%202023.
S&P Global. 2023. EU gas storage fullness surpasses 2022/23 winter peak: GIE. Available at: https://www.spglobal.com/commodityinsights/en/market-insights/latest-news/natural-gas/100323-eu-gas-storage-fullness-surpasses-202223-winter-peak-gie
World Bank Group. 2023. Commodity Markets Outlook: Under the Shadow of Geopolitical Risks. October.