Publications /
Opinion

Since the Fed’s July meeting, when the Fed Funds Rate had a 0.25% cut, fears about the impact of the US-China trade war on the global economy have escalated. The US yield curve inversion received much attention as a harbinger of a slowdown in the global and US economic outlooks. We approach here whether lights on next monetary policy events can be obtained from reading the minutes of the Fed’s meeting – and of the July meeting of the ECB governing council – released this week.
The US Economy Has Been in Good Shape but Financial Markets See High Risks Ahead
Fed minutes of the July meeting released on Wednesday discussed the monetary policy strategy and remarked that the 0.25% cut in Fed Funds Rate was a mid-cycle adjustment, with next moves to be data dependent. Therefore, they reaffirmed President Powell’s post-meeting statement that it was not the beginning of an easing cycle as investors were demanding or expecting. It is worth taking note that “a couple” of FOMC members favored a 0.5% cut, whereas “several” members argued in favor of keeping the rate where it was.
Interestingly, the market is now expecting more rate cuts for the rest of the year than it did prior to the actual Fed rate cut. It seems that president Trump’s escalation of the trade war on the day after the last Fed meeting and China’s currency devaluation have aggravated fears about the effects of the trade spat on economic growth ahead. During the Fed’s meeting, FOMC members highlighted risks associated with trade uncertainty as a headwind for the outlook.
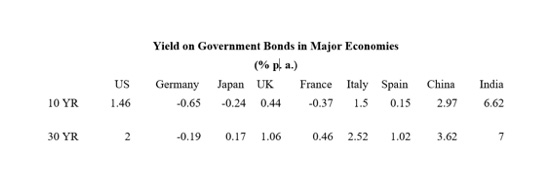
Market expectations explain why the Fed’s rate cut of 0.25% in July did not go well with the market participants which expected a 0.5% rate cut. The market claim for a deeper rate cut was not only based on the declining consumer confidence and investment sentiments, but also the negative interest rates on the other side of developed world. A 1.75 to 2% interes- rate differential between Germany-Japan and US is large enough to invite capital inflows into the US. It has been driving the dollar stronger, adversely affecting exports. It is worth remarking that the account of the July monetary policy meeting of the ECB governing council, also released this week, reported a “broad agreement” on reintroducing an easing bias on interest rates and a potential reopening of its asset purchase program.
Looking to the Fed’s twin objectives of Maximum Employment and Price Stability, the rate cut can be rationalized as to make allay concern on and stem the possibility of a slowdown in growth and keep the labor participation high. A rate of inflation still running below the target of 2% justified the rate cut. Minutes did not refer to any likelihood of recession. It observed that the consumer spending was strong in the first quarter, and that the lower GDP growth in the second quarter was caused by slower growth in consumer spending, as well as lower investment and government spending. So, the mid-cycle adjustment would aim at mitigating risks, not boosting growth.
The yield curve inversion and its hint on an imminent recession were in discussion. Some participants referred to the concern that the inversion of the Treasury yield curve, as expressed by the 10-year yield falling below the 3-month yield, had persisted for about two months. That might reflect market participants’ expectation of slowing economic conditions in the future and that the Federal Reserve might be led to lower the federal funds rate substantially in response.
On the other hand, FOMC participants saw current conditions as likely to remain in the immediate future, with sustained expansion of economic activity, tight labor market, and inflation close to the symmetric 2% target. The real GDP growth of 1.6% in 2016 rose to 2.4% in 2017 and 2.9% in 2018. During 2018 the Fed raised Fed funds rate four times from 1.5% to 2.5%. Slowdown in growth was visible in Q4 in 2018 when it declined to 1.1%. Yet the growth rate recovered in Q1 2019 to 3.1% and recorded 2.1% in Q2.
The decline in Q4’18 was primarily caused by a decline in the private investment growth to 3% from very high rate of 13.7% in Q3’18. In Q2’19 private investment fell by 5.5%, exports declined by 5.2%, and growth rate declined to 2.1%. While unemployment is at the record low of 3.7% in last 50 years, inflation rate for urban consumers for all items in July 2.2% and 1.8% excluding food and energy items.
To summarize, there is a contrast between ongoing macroeconomic conditions and where markets are expecting them to go. The Fed’s mid-cycle adjustment is in the middle of that space. Not by chance, FOMC members emphasized the need to remain flexible…
Full Yield Curve Saucer Shaped, not Inverted
Although the yield curve of between 1-month and 10-year Treasury rates is inverted, it is only a third of the full yield curve. On August 14, 2019 the yield on Treasury bonds showed a decline from 1.98% to 1.46%. But it moves up to 1.84% for 20 years Treasury and to 2% for 30 years. Hence, we have a saucer-shaped yield curve, with the yield declining until 10 years, but rising back to higher levels for 30-year Treasury.
Of late the phenomenon of a halfway inverted curve has stirred up a speculation that it is a sign of imminent recession. If you ignore the yield slide from 1 year to 10 years Treasury, the yield curve for Treasuries is actually flat at 2% from 1 month to 30 years. The US Inverted (Saucer)-Flat yield curve reflects both a broad rise in risk aversion, as well as negative yields in other advanced bond markets, and cannot be taken simply as a reading of clear signs of a US GDP-growth slowdown ahead. The perceived likelihood of a slowdown has increased – and this may weigh down on spending decisions – but it is still to be confirmed by future downside events, including future policy choices that might justify the increased pessimism.
Negative Yield Bond Markets
Several developed market economies have been facing zero to negative real interest rates. While nominal interest rates have ranged between -0.5% to 0% and 2%, the consumer price inflation between 1% to 2% have taken real interest rates to zero and negative territories. Risk-free rate financial securities (Government Bonds) in several developed markets have been giving negative real interest rates.
Since 2014, when sovereign debt started yielding negative returns, the size of investment grade corporate and sovereign bonds from Europe and Japan has risen manifolds to $ 14 trillion, accounting for 24% of the global investment grade debt. European government bonds with negative yields have reached a figure of US$5 trillion. 88% of German government bonds, 74% of Japanese bonds and 76% of French bonds are currently yielding negative yield.
In this scenario, US T bills and bond market stands out very positively. US Treasury and Bonds of $16 trillion form 70% of the global sovereign bonds market. It is a formidable size and strength in the global financial markets. Foreign Government holdings of US T bills and bonds amounts to $6 trillion. Looking to the size of the negative yielding market of $16 trillion and the positive interest differential of 1.75% to 2% relative to the German and Japanese government bond, the foreign investment in US bonds is increasing. Downward pressure on the yields on US bonds is exerted by foreign capital inflows into US bonds. The inverted yield curve is partially a reflection of this interest rate differential and also of the market view that in the medium term interest rates will remain low due to the lower global growth forecast.
Former Fed Chair Janet Yellen also recently observed that the yield curve inversion is partially an effect of the global interest rate differential in favor of the US Treasury causing large capital inflows from abroad into US Treasury Bonds. At the Jackson Hole meeting yesterday, Philadelphia Fed President Harker agreed with this view and said any action to reverse the inversion in the yield curve is getting negated by greater inflows from abroad into 2- to 10-year Treasuries.
Global Slowdown and/or Financial Turmoil Ahead?
What is the message from the market through the unusual and abnormal saucer-shaped Treasury yield curve? The yield curve reflects both the US economic and monetary situation as well as the international perception of the global and US economy. Slower growth in Europe, Japan, China and possibly US are a concern. The negative sentiment is further compounded by the tariff struggle affecting trade and investment. If lower growth becomes a reality in 2020, interest rates in the US will have to come down from the current level. This growth perspective is influencing interest rate expectations that are bringing downward pressure on US Treasury yields. The negative interest rate scenario is compounding this effect by increasing the demand for US Treasuries, regarded as the financial safe haven in current uncertain times.
Yet another factor impinging on the yield curve is the growing risks in the debt or financial markets that may cause a financial turmoil. Will the Black Swan of 2008 glide again or might we have multiple smaller-scale problems leading to a slowdown – and even recession? FOMC members indicated high levels of non-financial corporate debt and leveraged lending as sources of risks to the outlook. Debt levels globally in household, corporate and government accounts are continuing to rise without any respite. Will the US be forced to go to near zero interest rate to salvage the financial markets and economy? These are concerns which are also manifest in the US Treasury yield curve.
What may one conclude? On the ECB side, signs are clear that monetary policy will get looser, whereas the Fed will wait and see to what extent the expected slowdown abroad will affect the US outlook, obliging it - or not - to move beyond its mid-cycle adjustment. At the end of the day, that will also depend on trade policy decisions and geopolitical events that are way beyond the scope of action by monetary authorities. A bad omen came today from President Trump when he asked in a tweet, "who is our bigger enemy", Powell or Chinese President Xi Jinping?, after China announced new tariffs on American products.
Satyendra Nayak is an Independent Investment and Economics Consultant with his own firm, Spectrafin. His experience stems from over 30 years of working in economic policy, global-macro, banking, mutual fund, and global investment and financial services industry.
Otaviano Canuto is a senior fellow at the Policy Center for the New South, a nonresident senior fellow at Brookings Institution, and principal at the Center for Macroeconomics and Development. He is a former vice president and executive director at the World Bank, executive director at the International Monetary Fund (IMF) and vice president at the Inter-American Development Bank.
Read also from the same author : Argentina’s Half-Baked Adjustment Has Not Worked